Boxes overview
Green square
Red square
Grey square

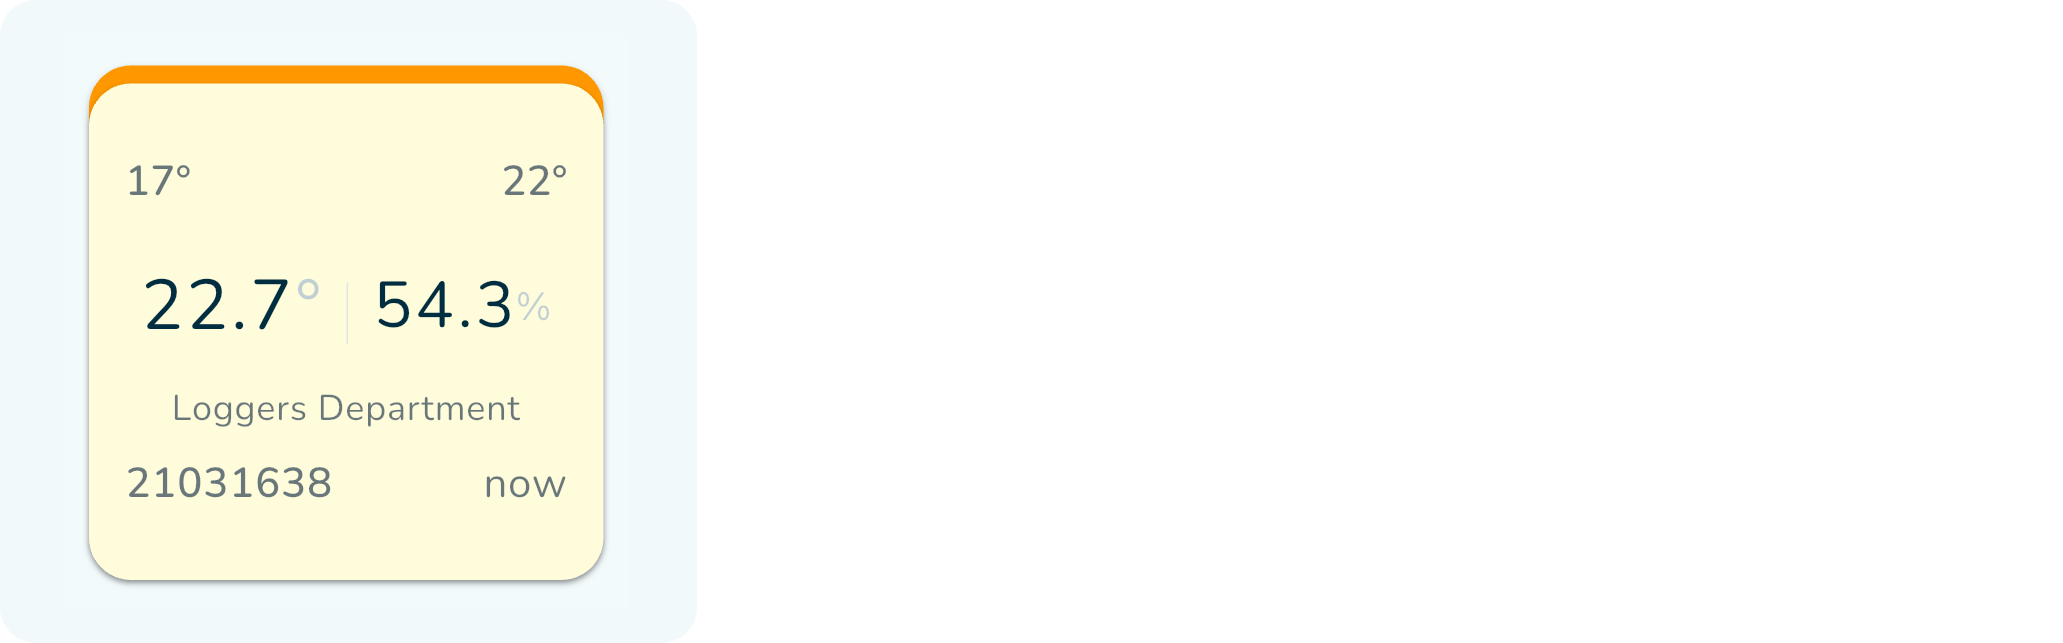
Yellow square
Temperature box

Temperature/light box

Temperature/humidity box

Flood box

Temperature/power box

Details
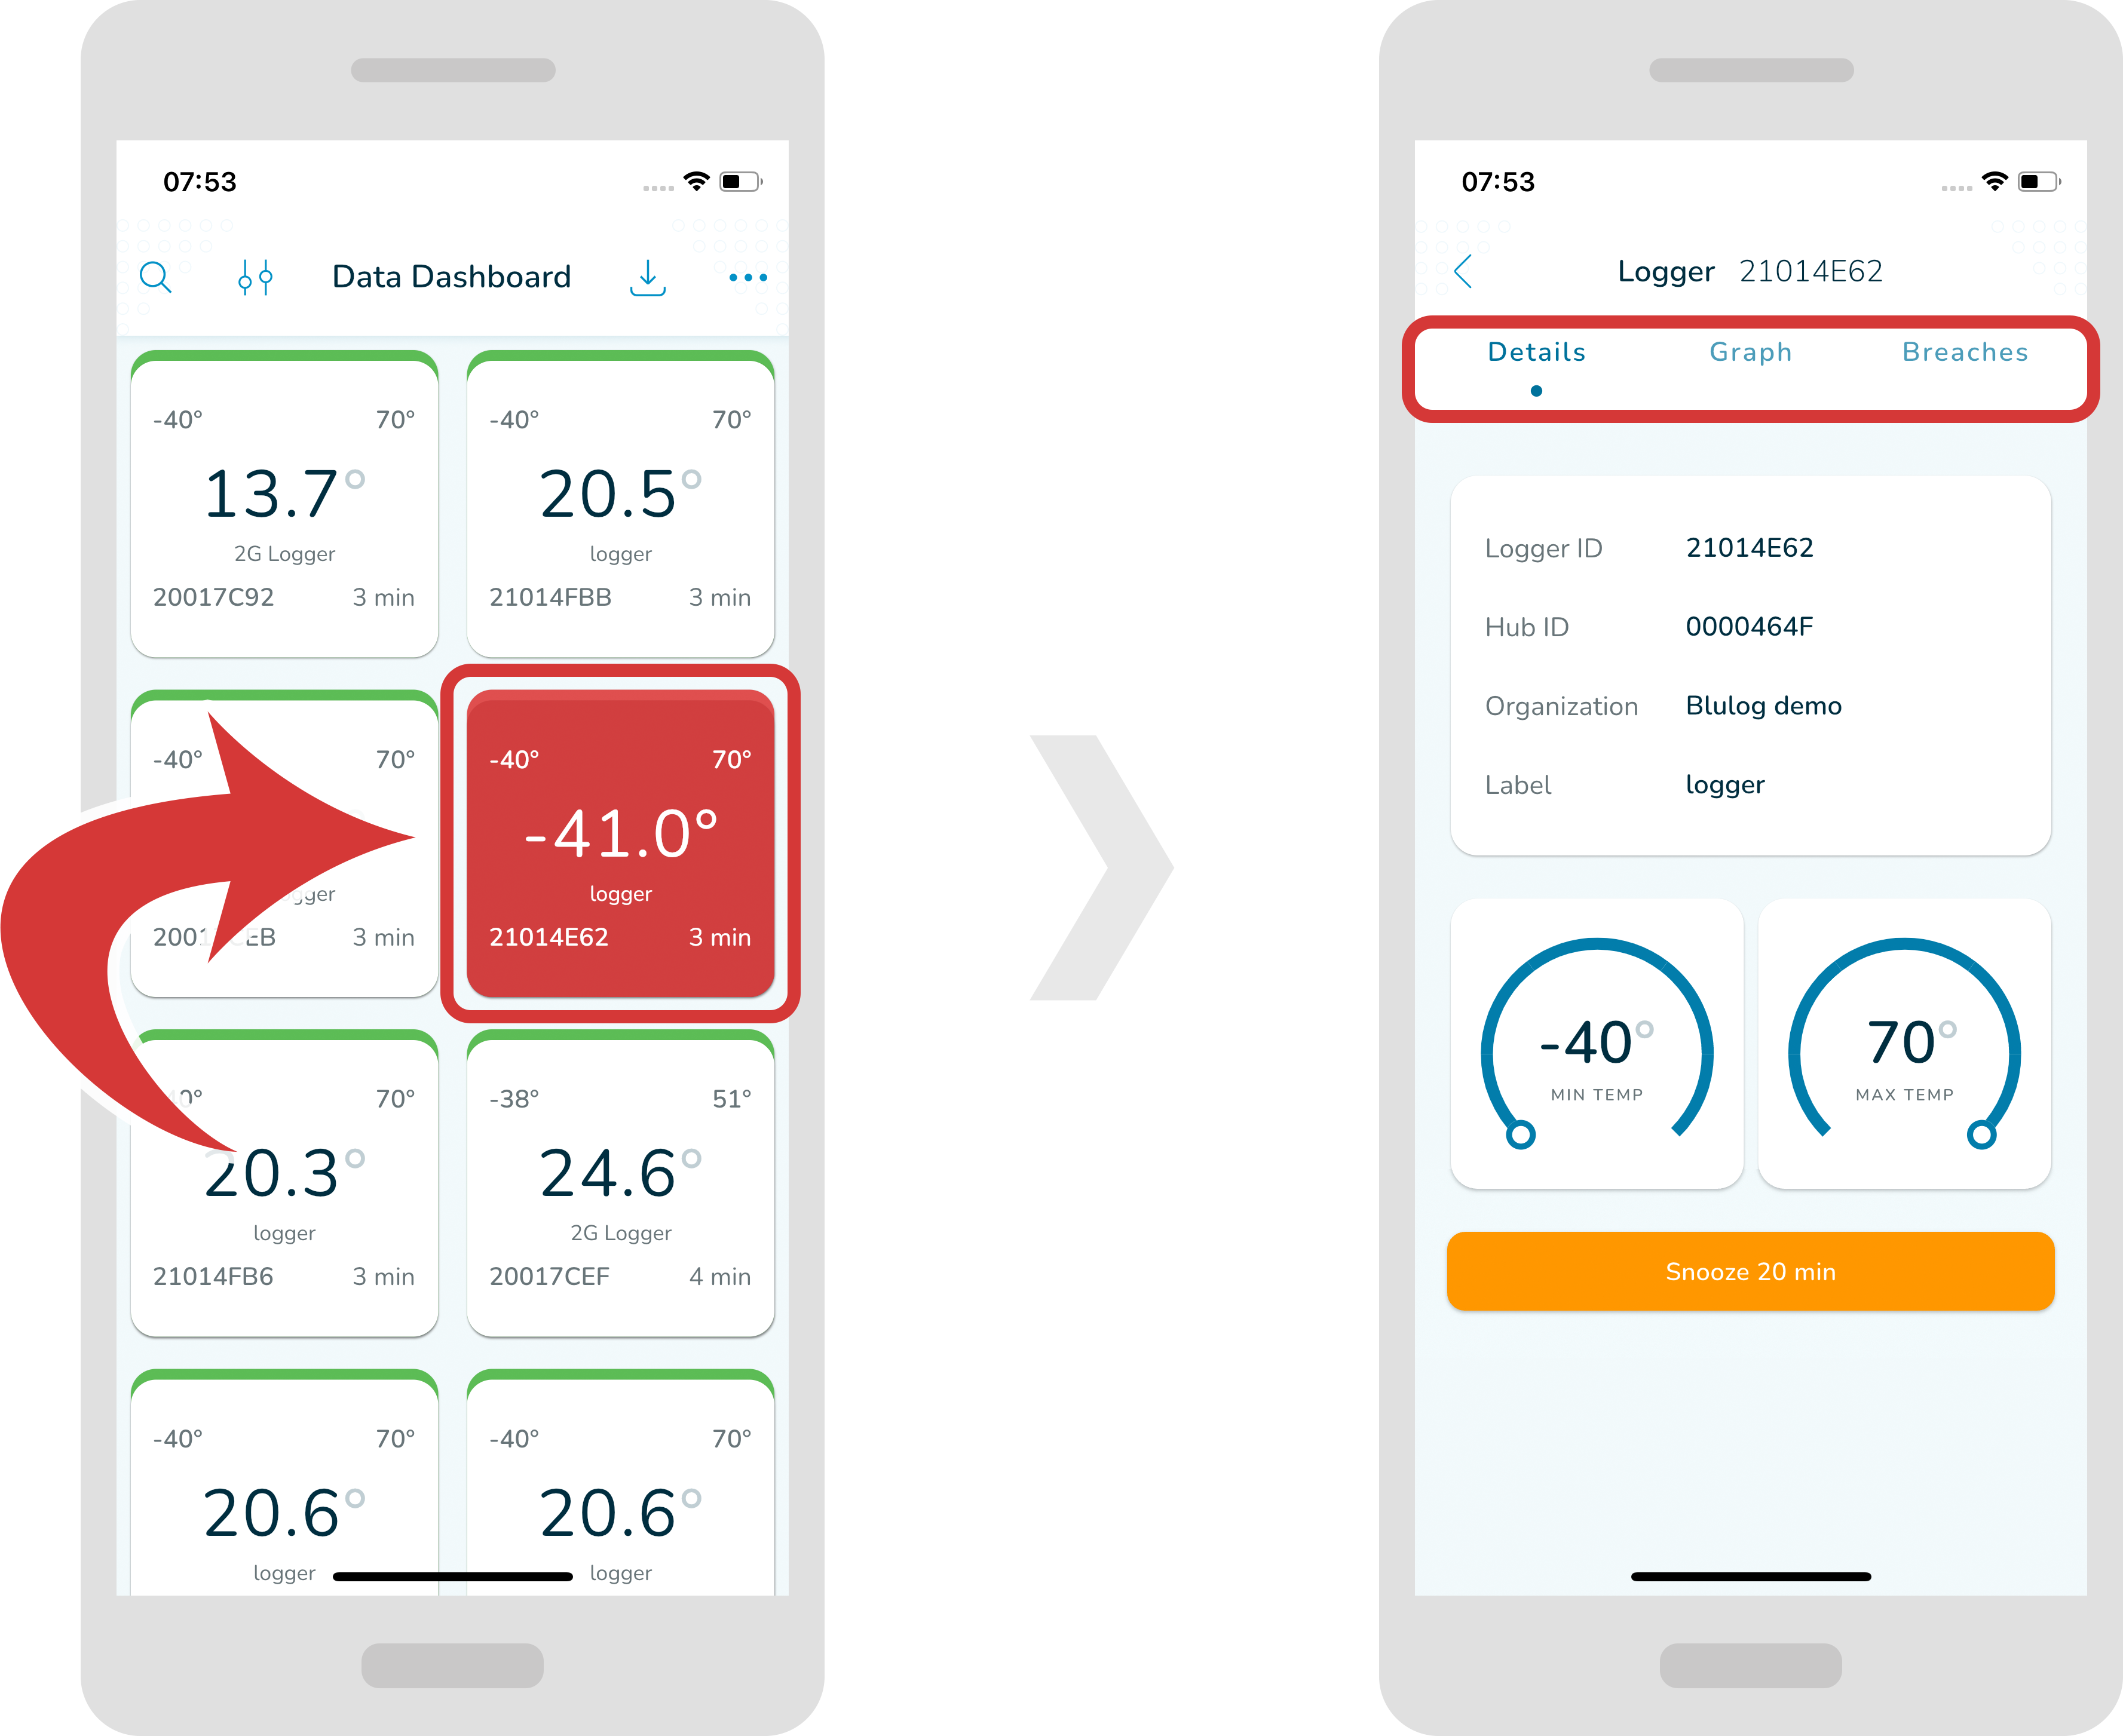
- In order to access more in-depth data, just tap into any logger. A new screen should appear. At the top you can switch between “Details”, “Graph” and “Breaches”.
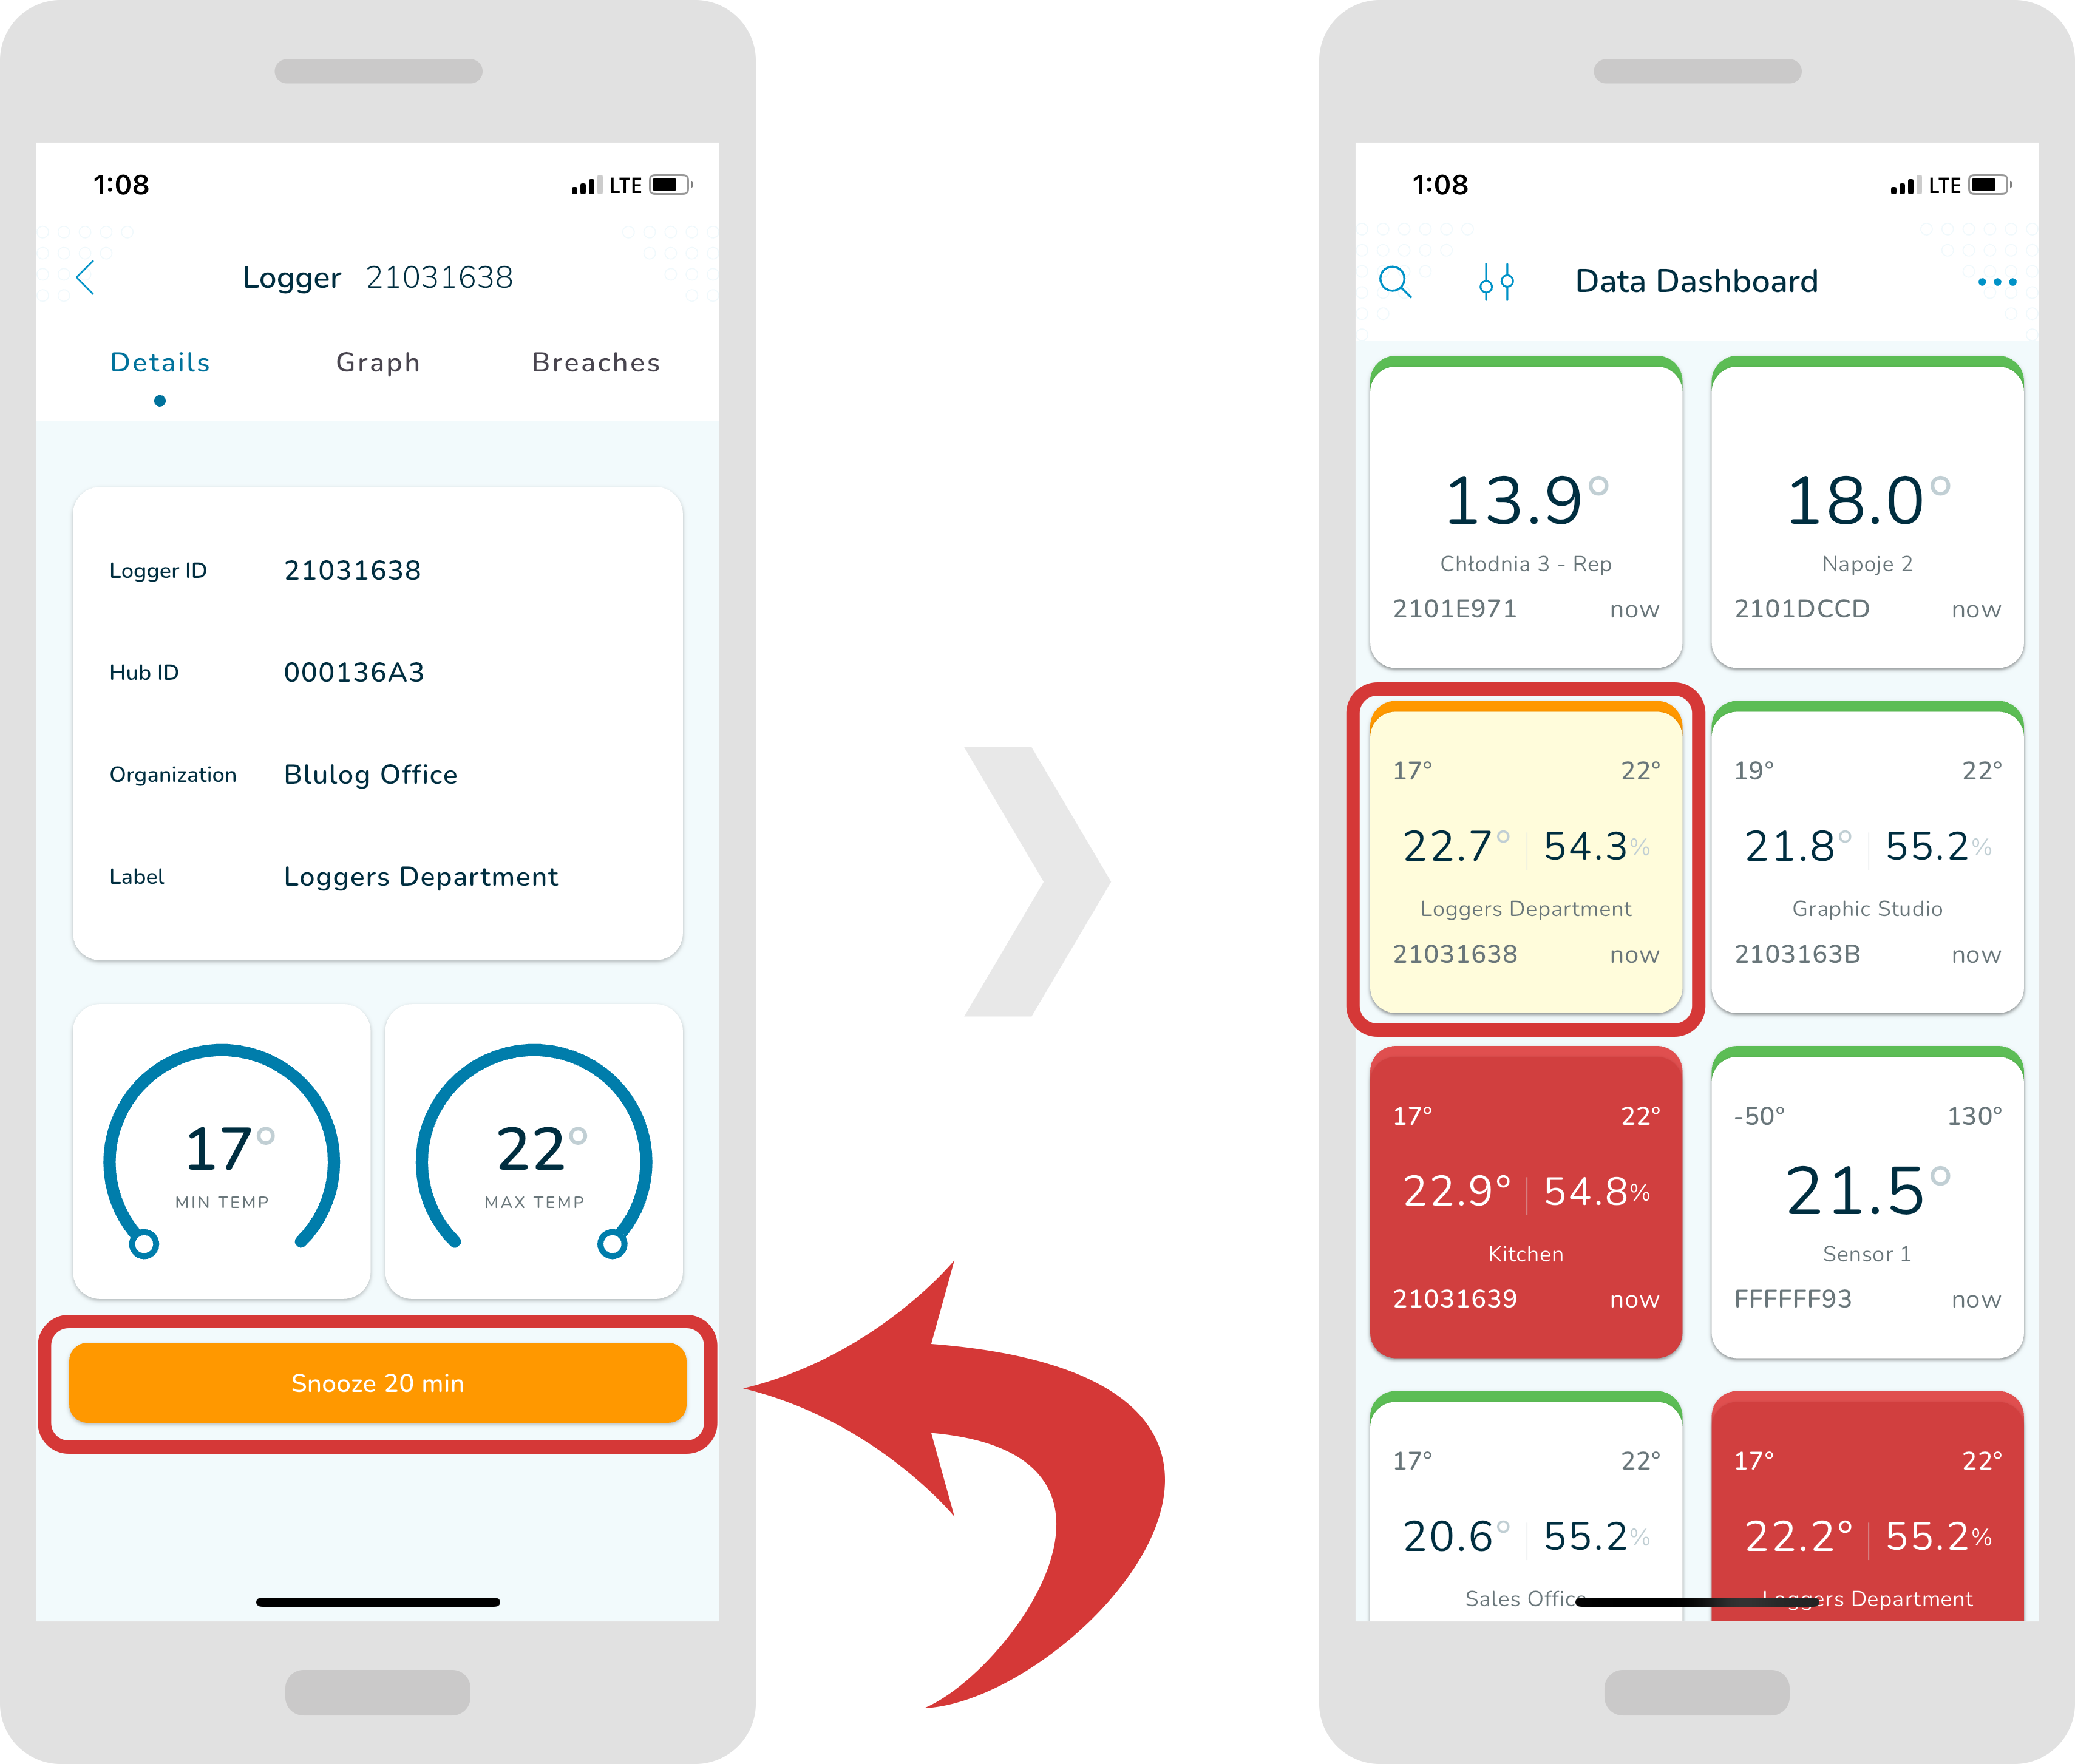
- In order to stop playing an alarm sound for a specific logger for 20 minutes, click the “Snooze 20 min” button. Once you click it, the logger becomes yellow.
Graph
In order to access the graph, tap into the logger and tap “Graph” at the top.
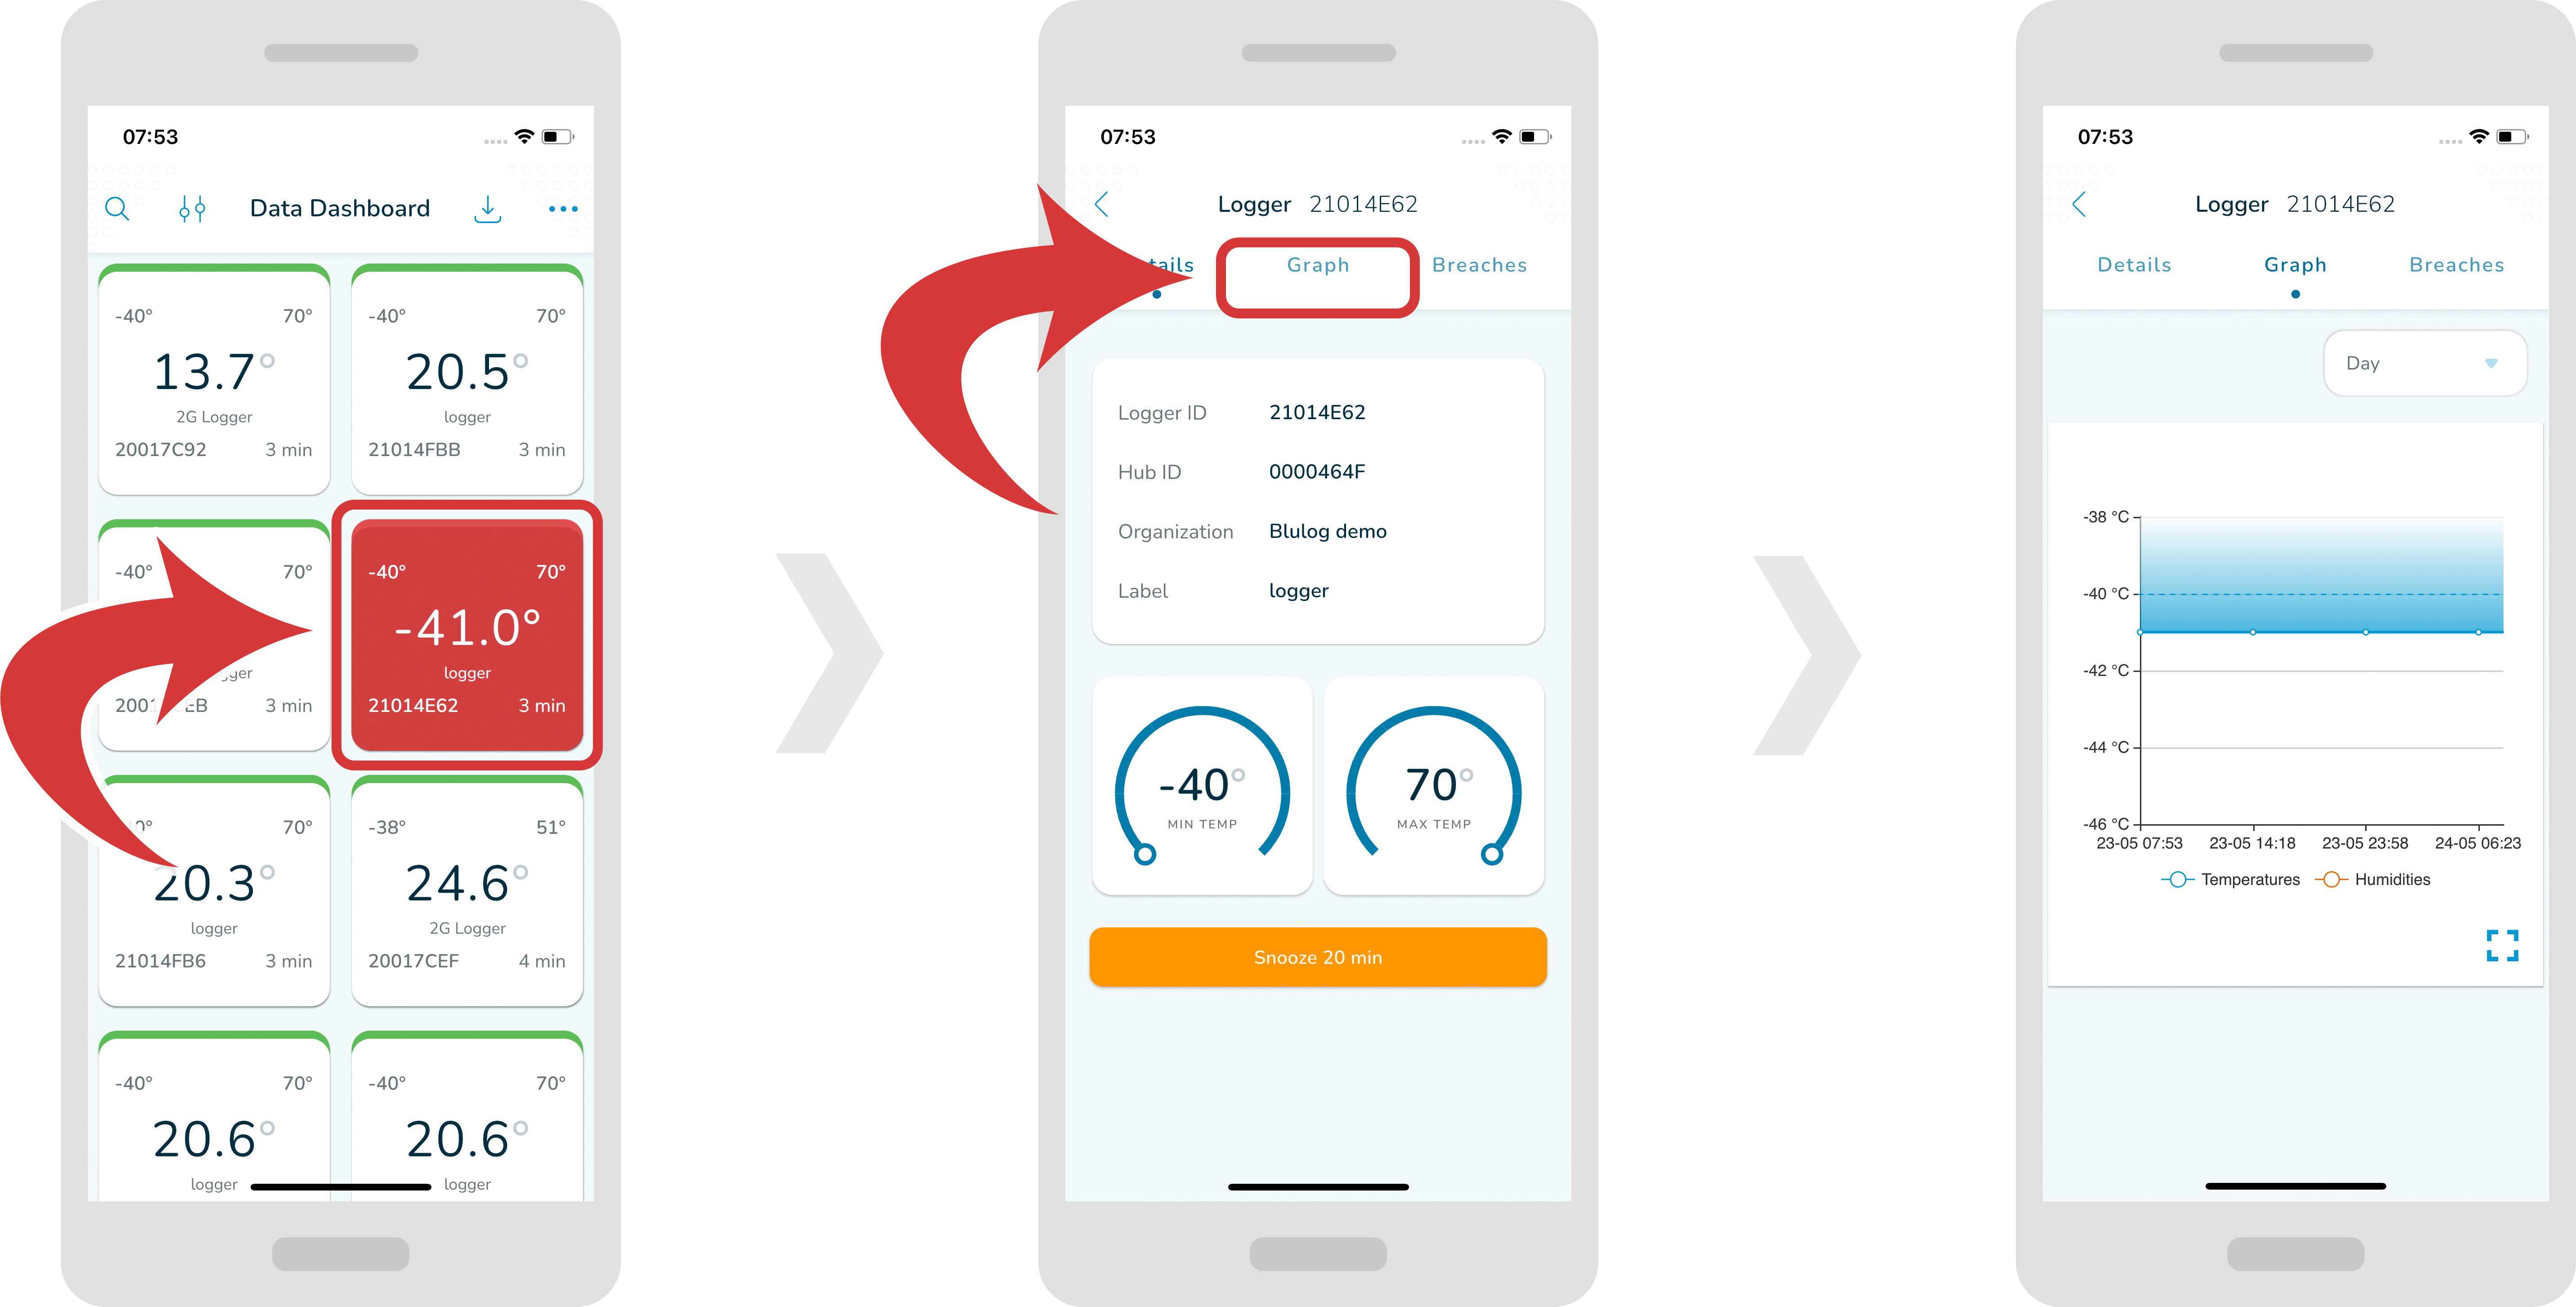
In order to change the date range, tap at the top right drop down menu and select a desired range.

In order to widen or shrink the graph horizontally, drag it or expand it with your fingers horizontally.

In order to see a graph on a full screen, tap on the “full screen” icon located at the bottom right. In order to quit the full screen mode, just tap on the “x” icon located at the top right.

In order to see a measurement for a specific point, just tap anywhere on the graph and a window should pop up with measurement information.

Breaches
- In order to access breaches, tap into the logger and tap “Breaches” at the top.
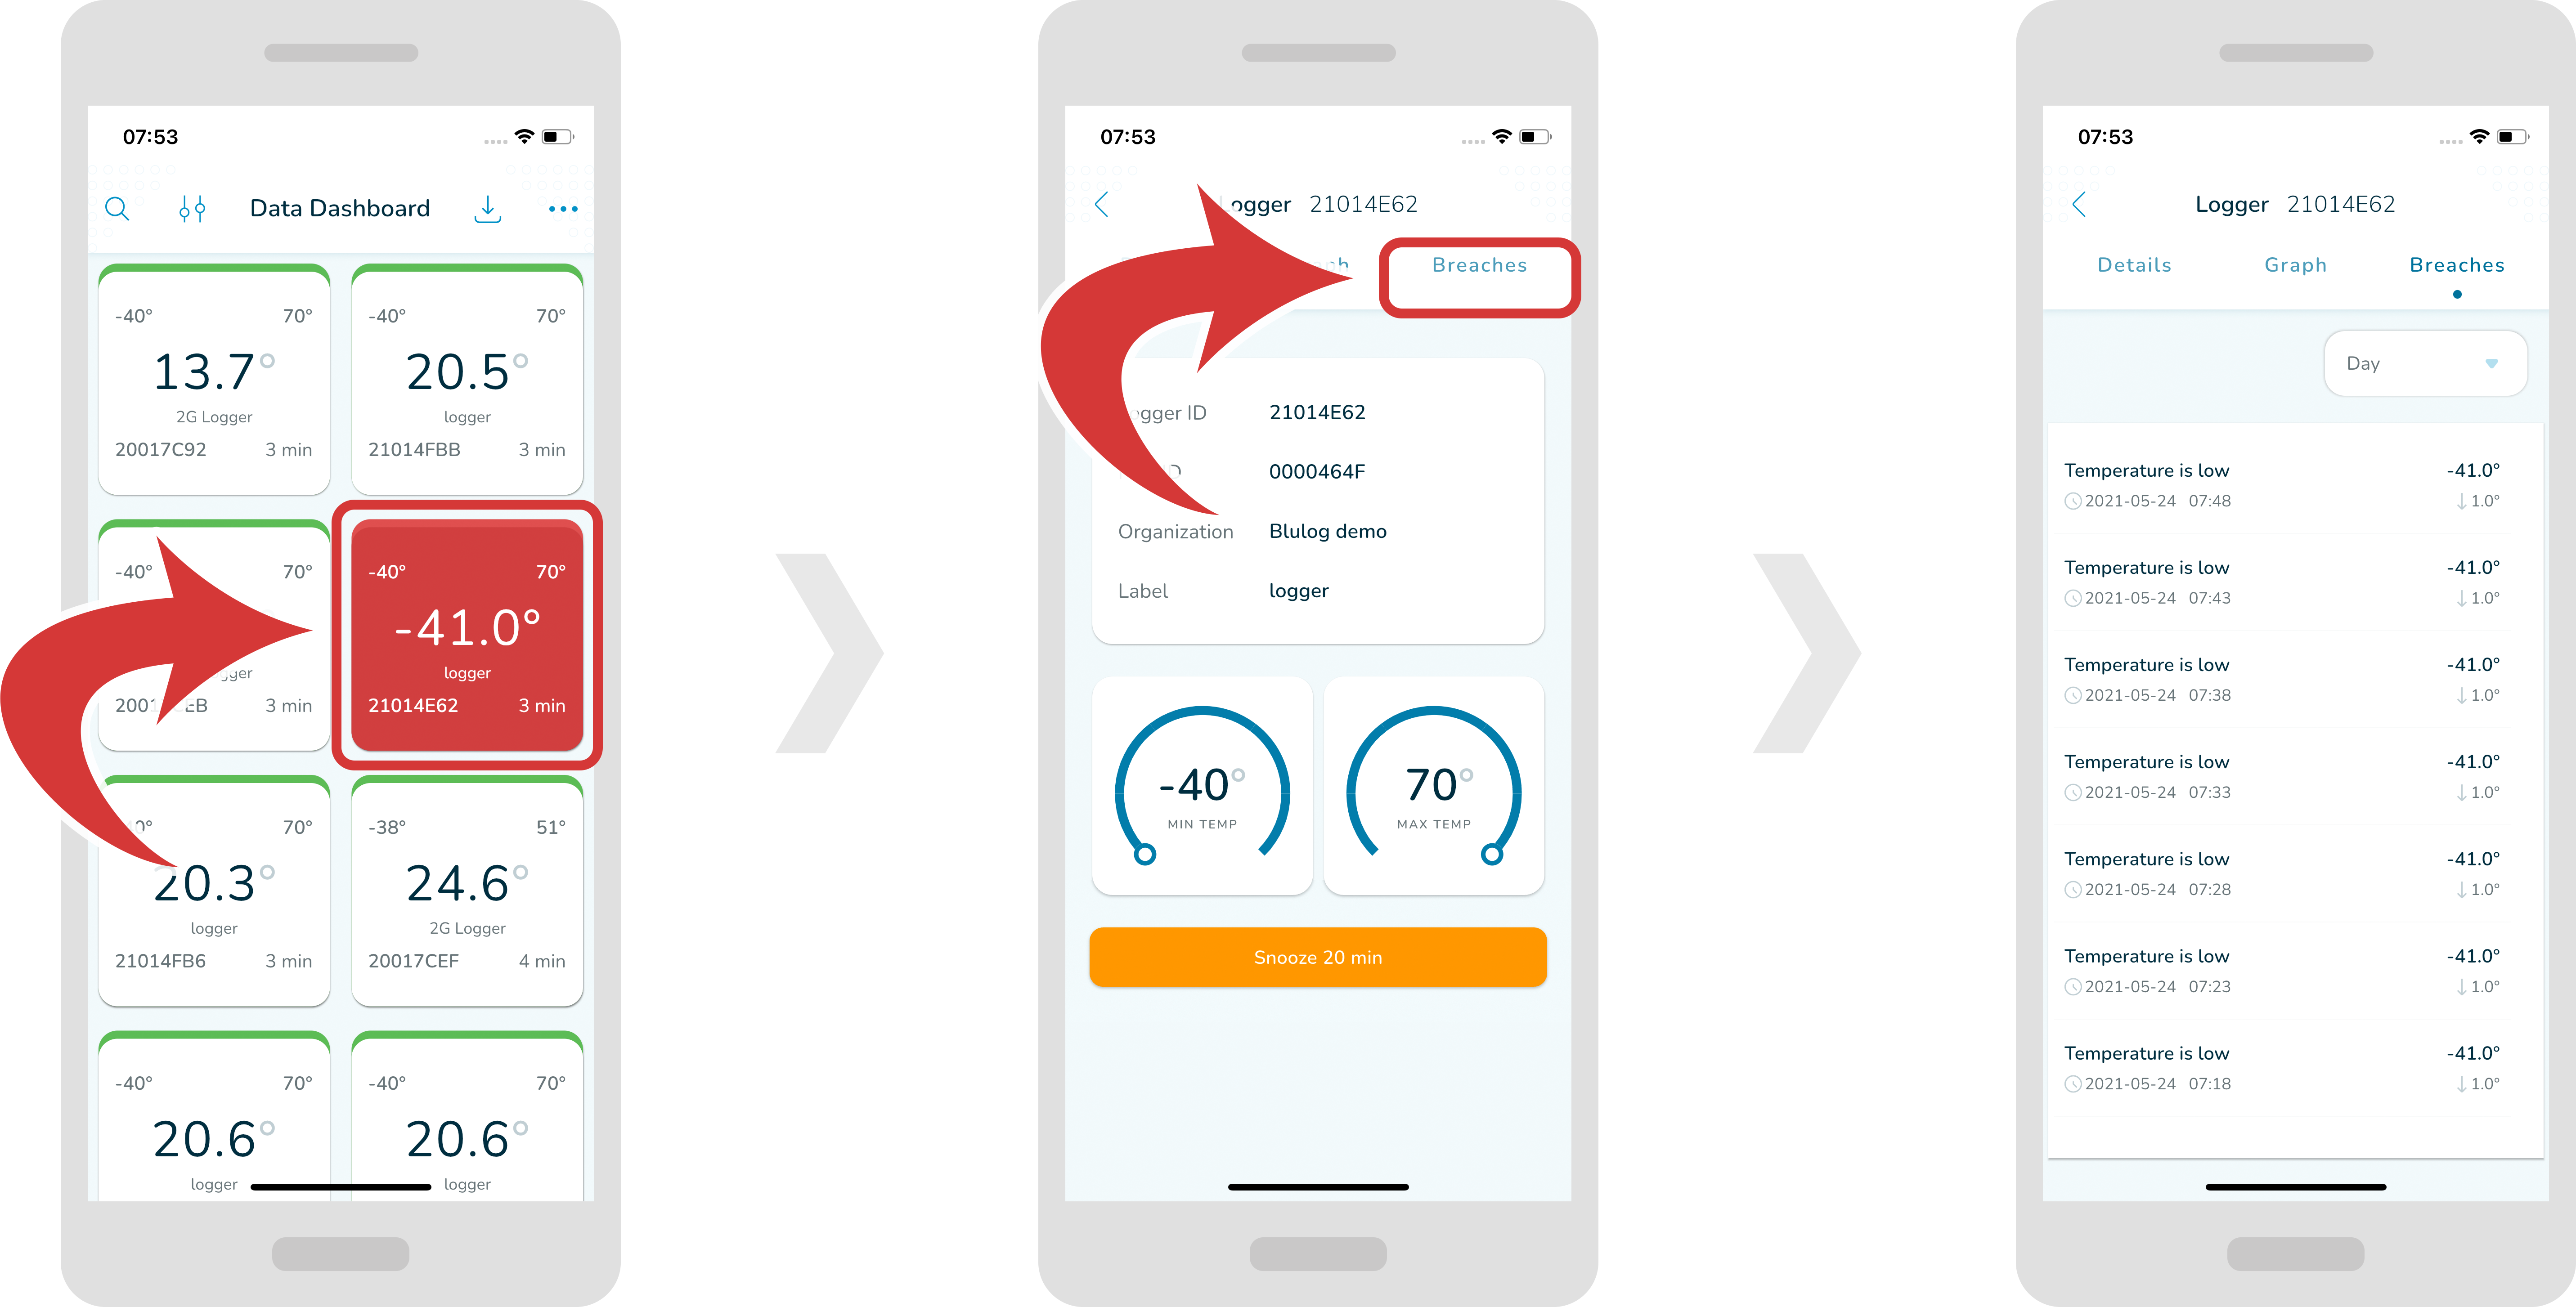
In order to change the date period for your breaches, tap on the drop down menu located at the top right and select a desired range.

