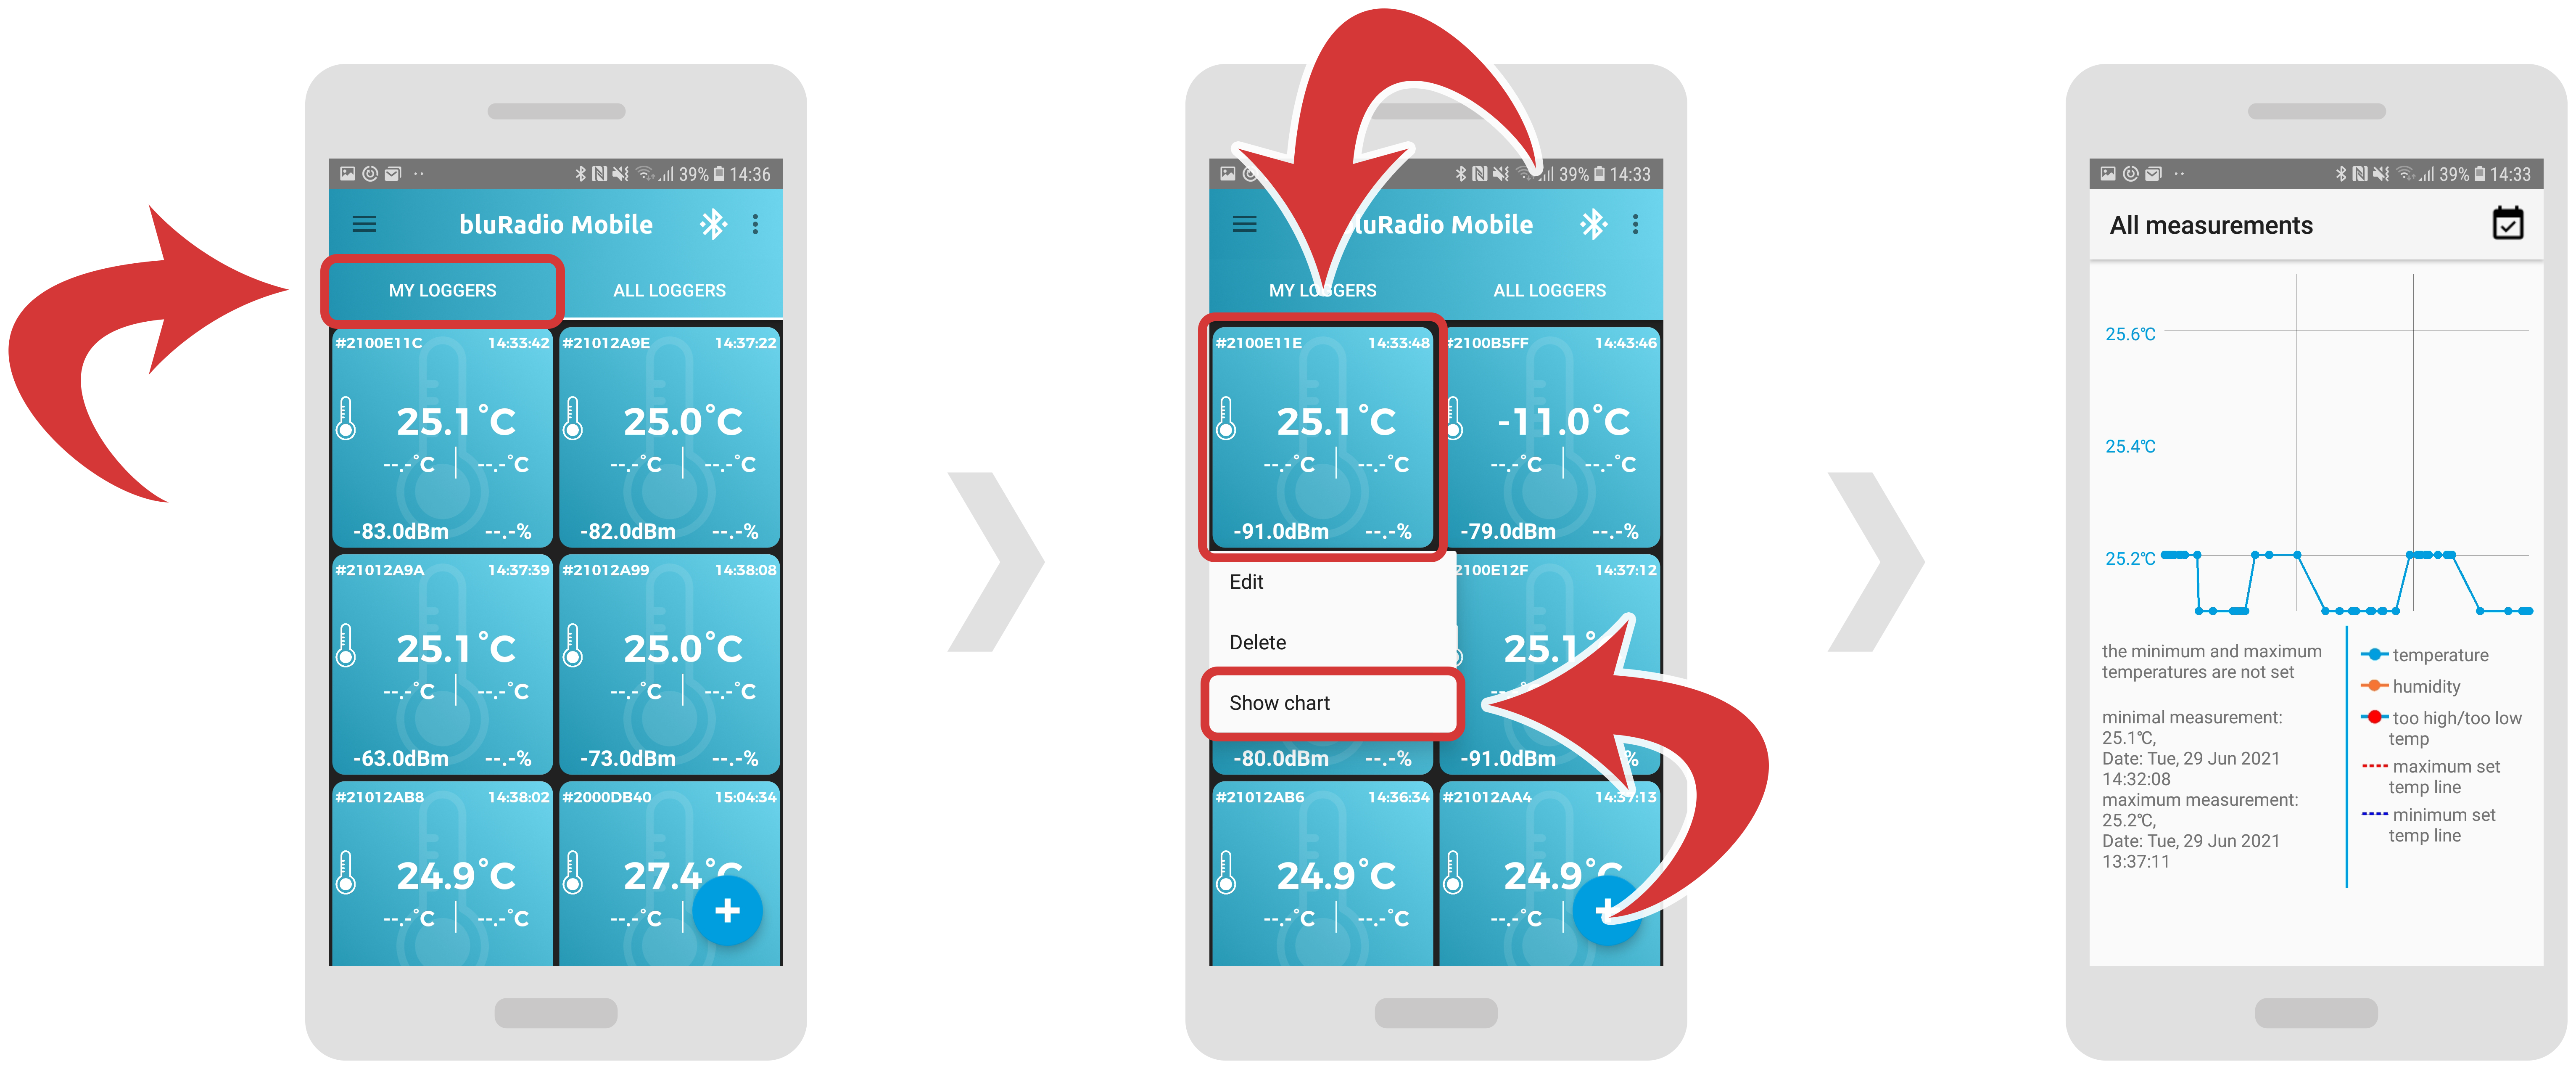
In order to show a chart for a specific logger, first make sure you are inside “My loggers” tab. Hold on to the specific logger.
Select “Show chart” from the list. A new page should appear with a chart.
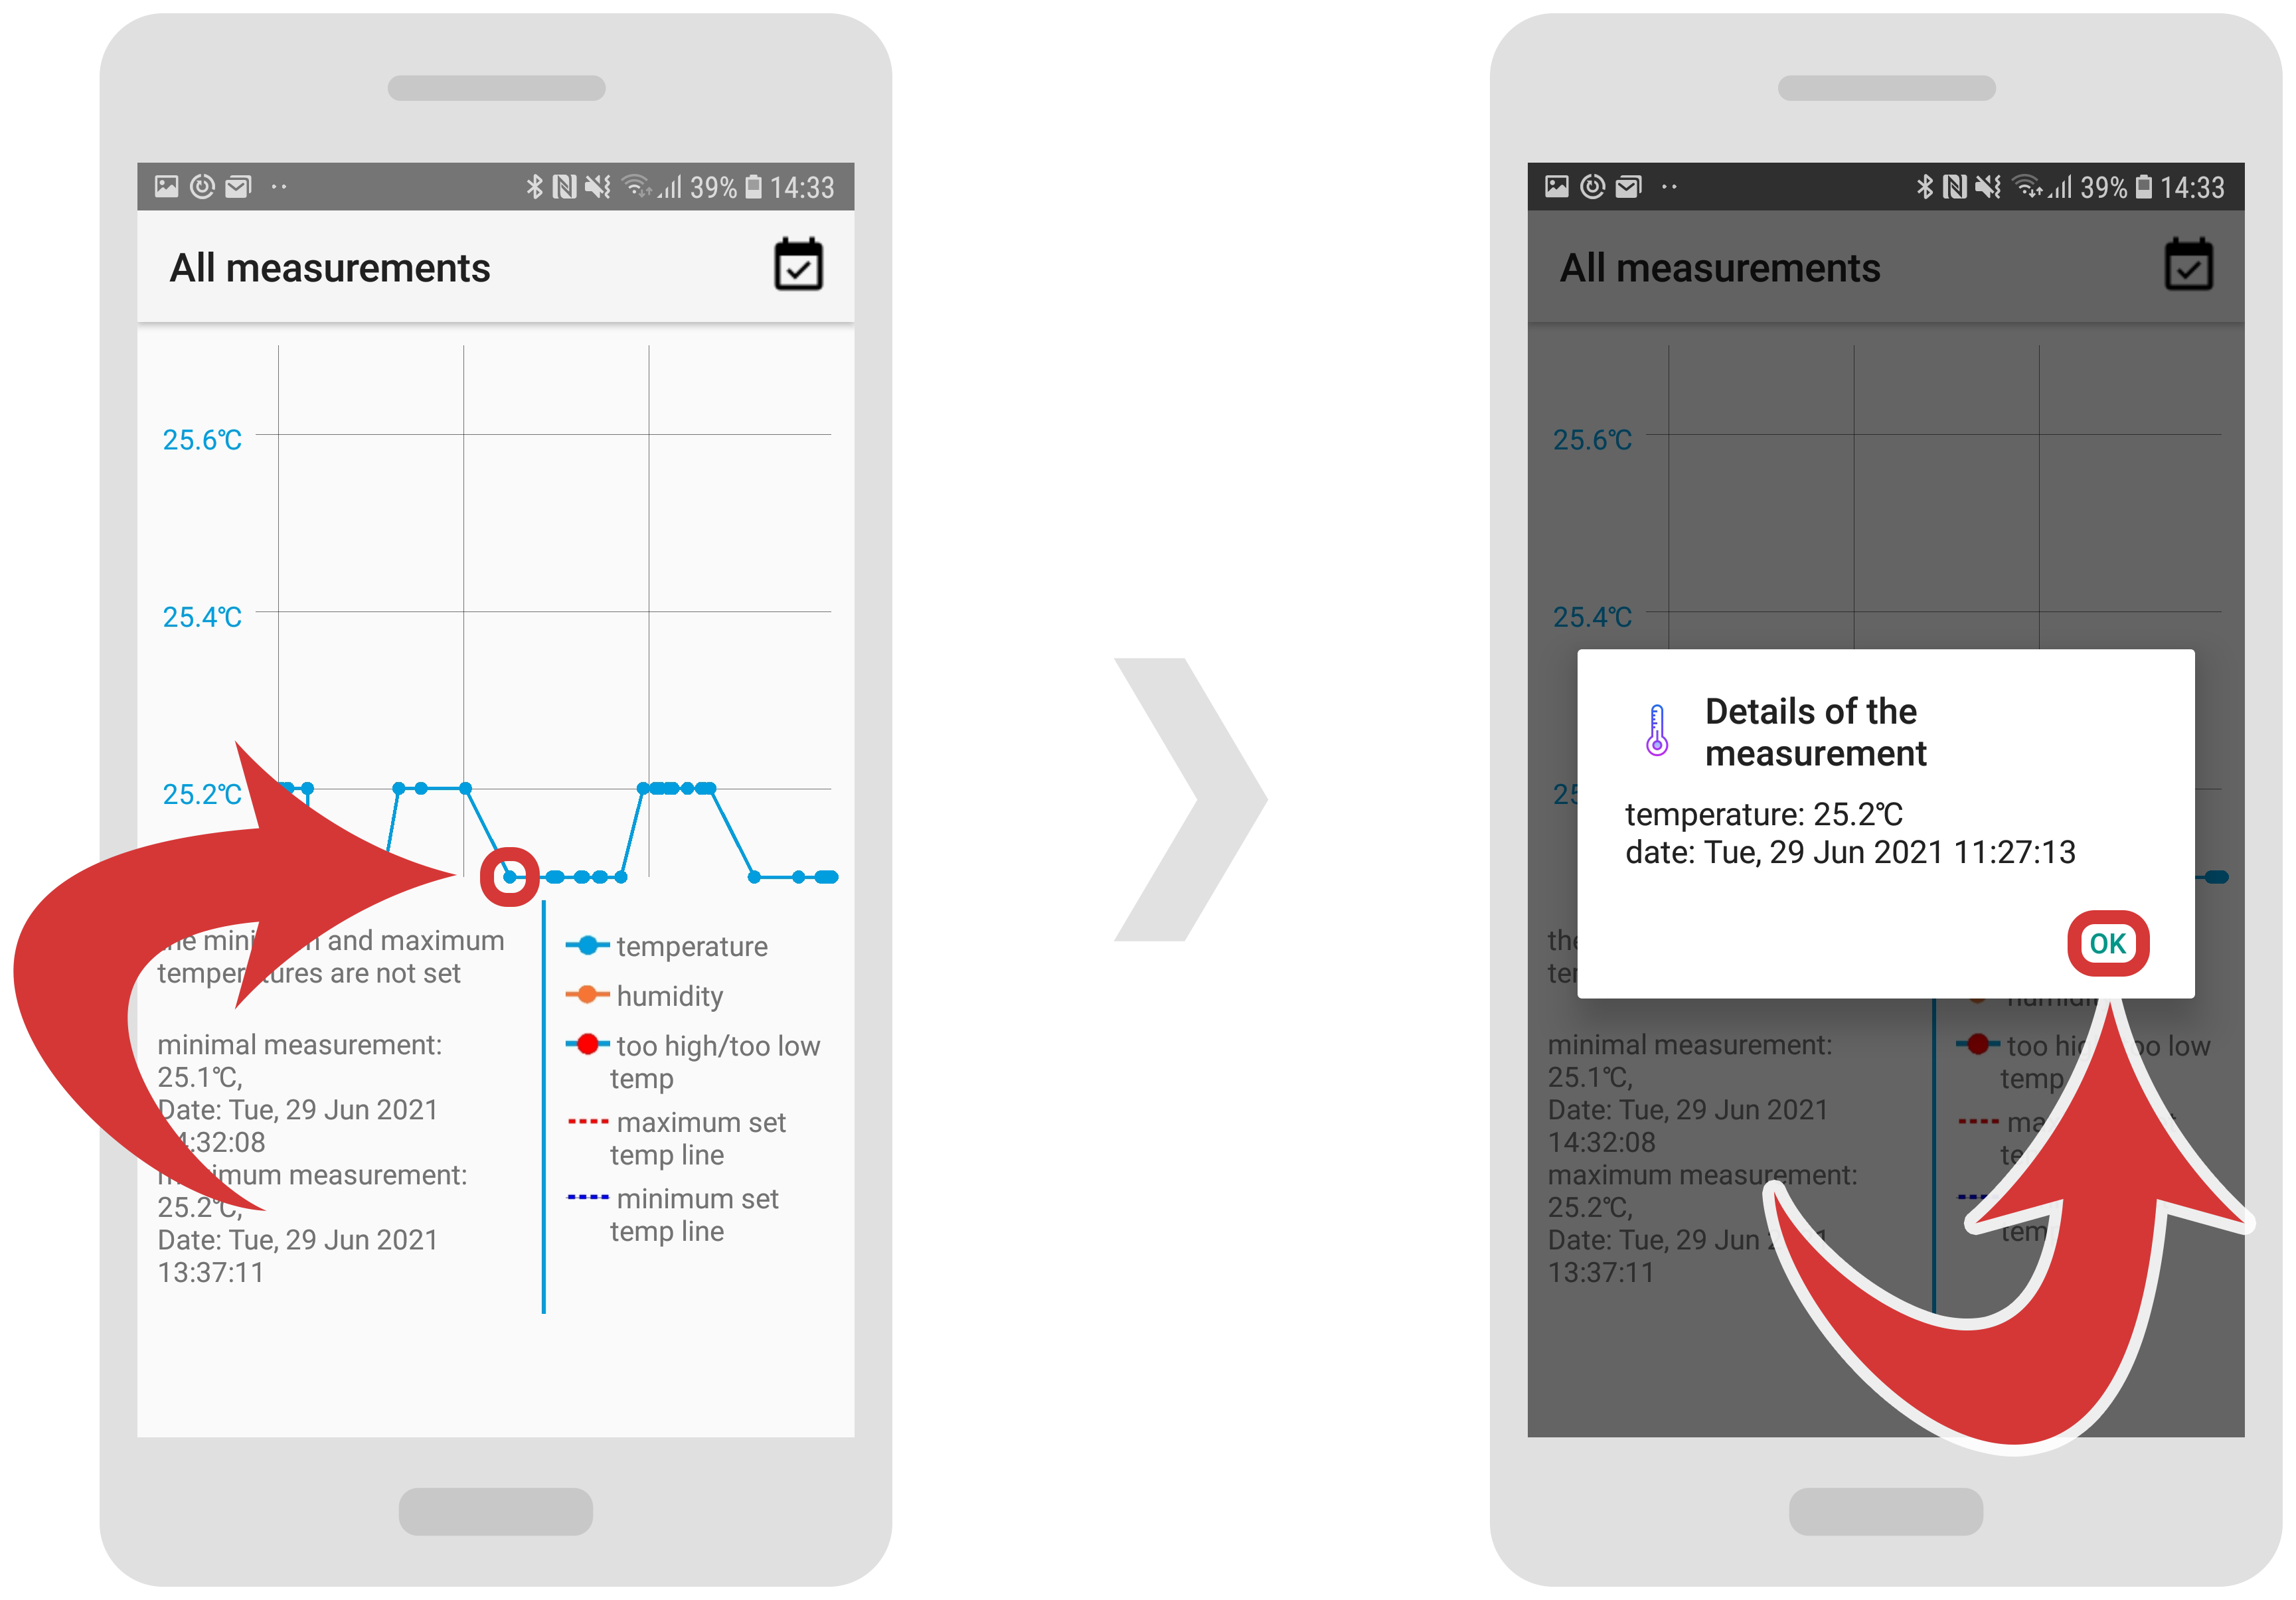
In order to see the details of a specific point on a graph, tap on the point. A new window should appear with more details. Press the “OK” link to close the window.
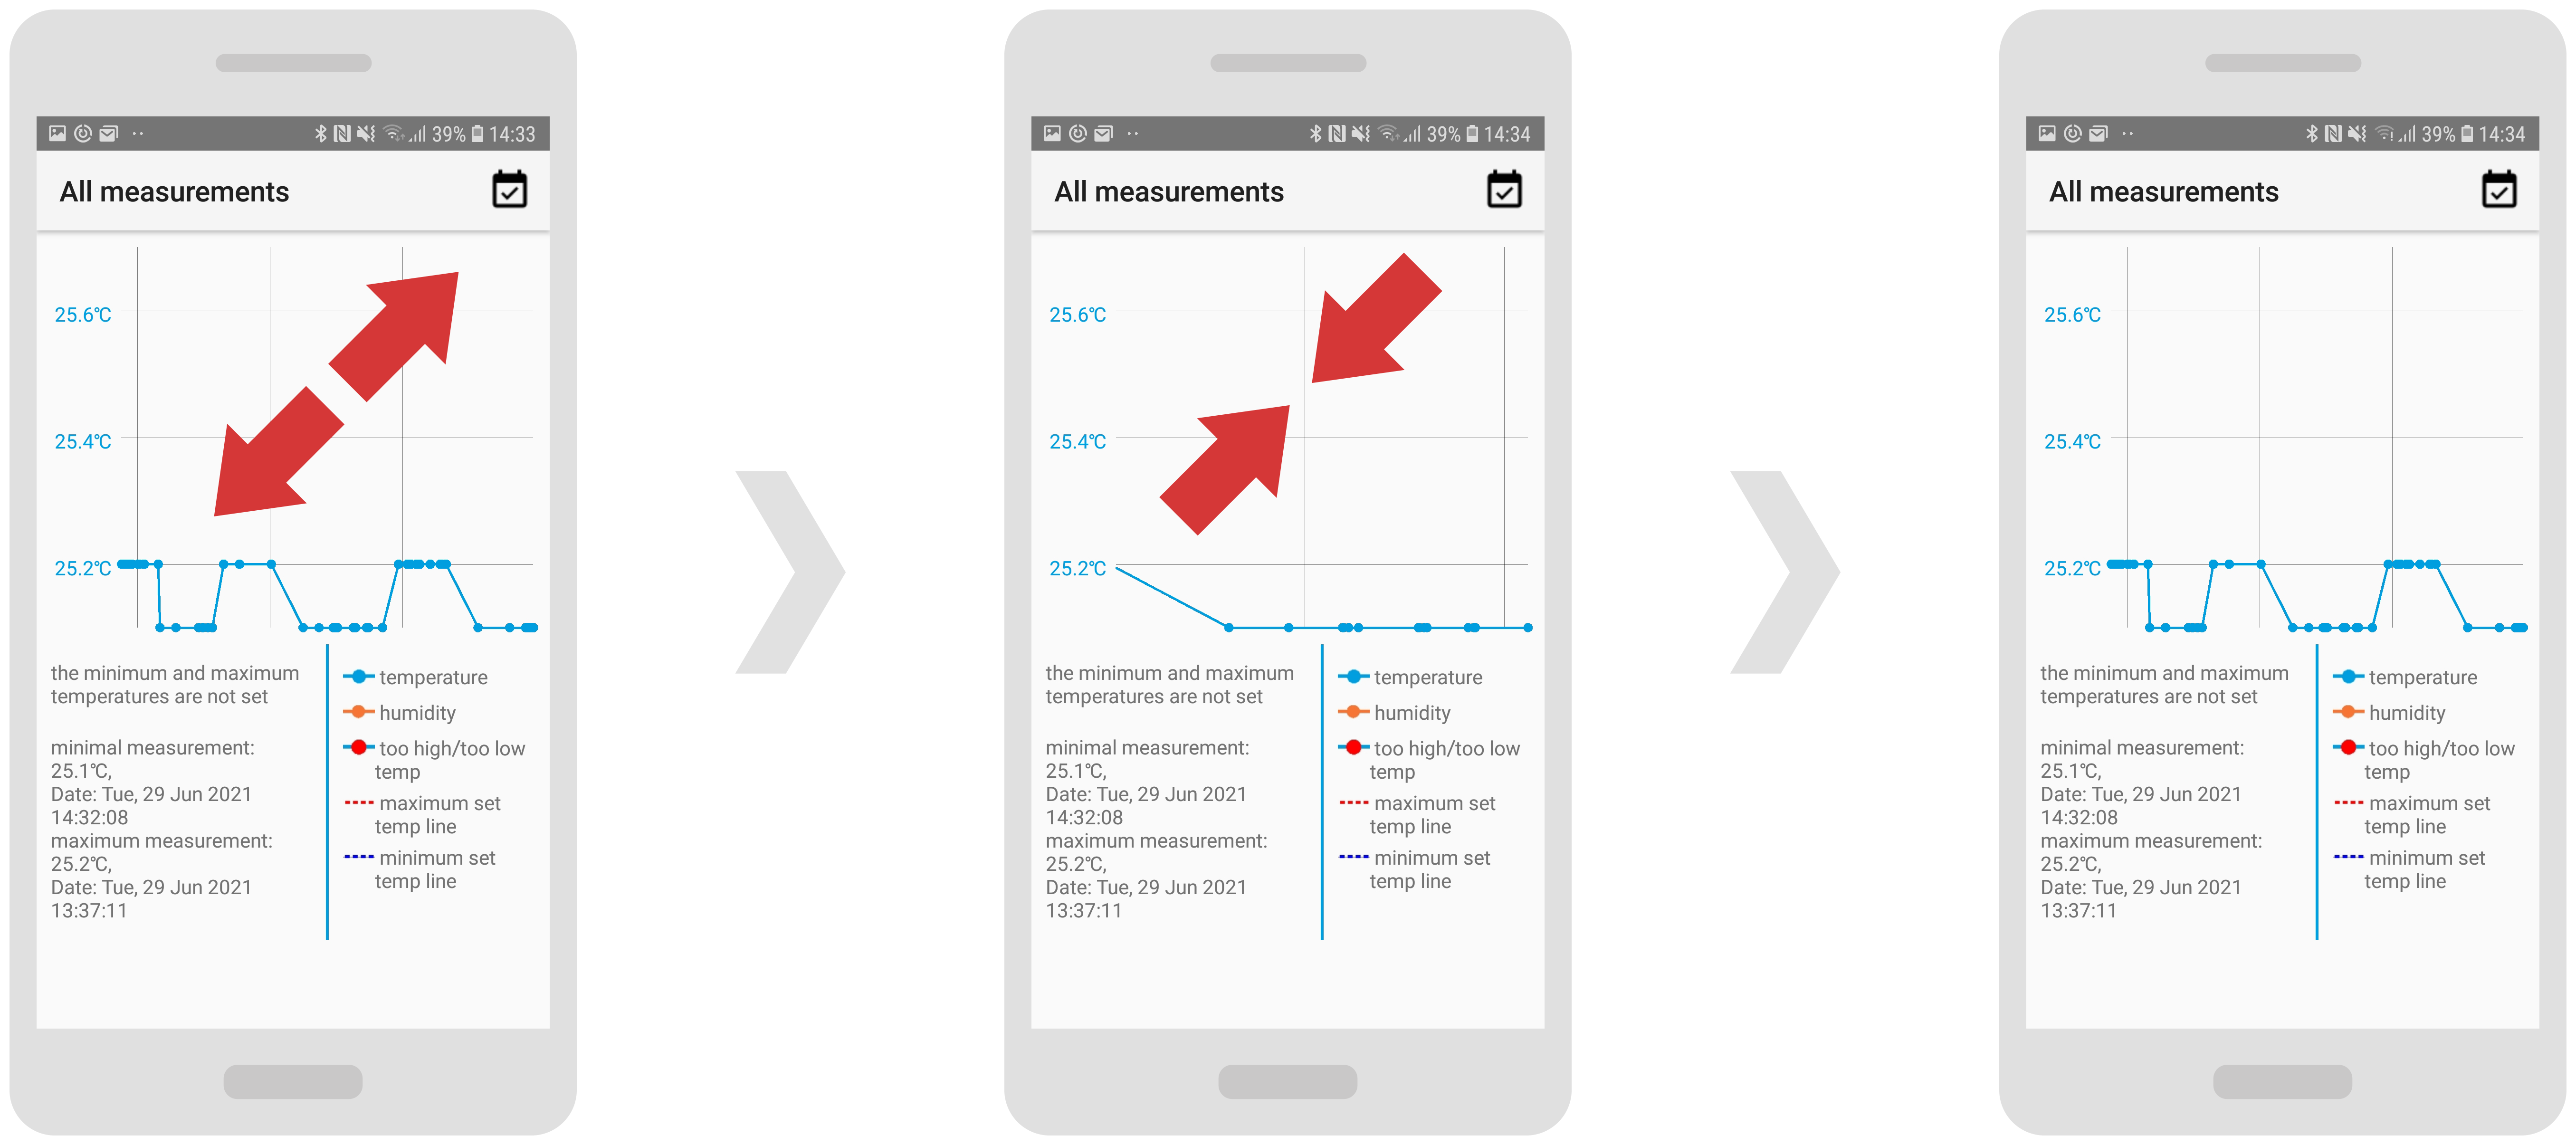
In order to zoom in/out a graph, expand it or shrink it with your fingertips.
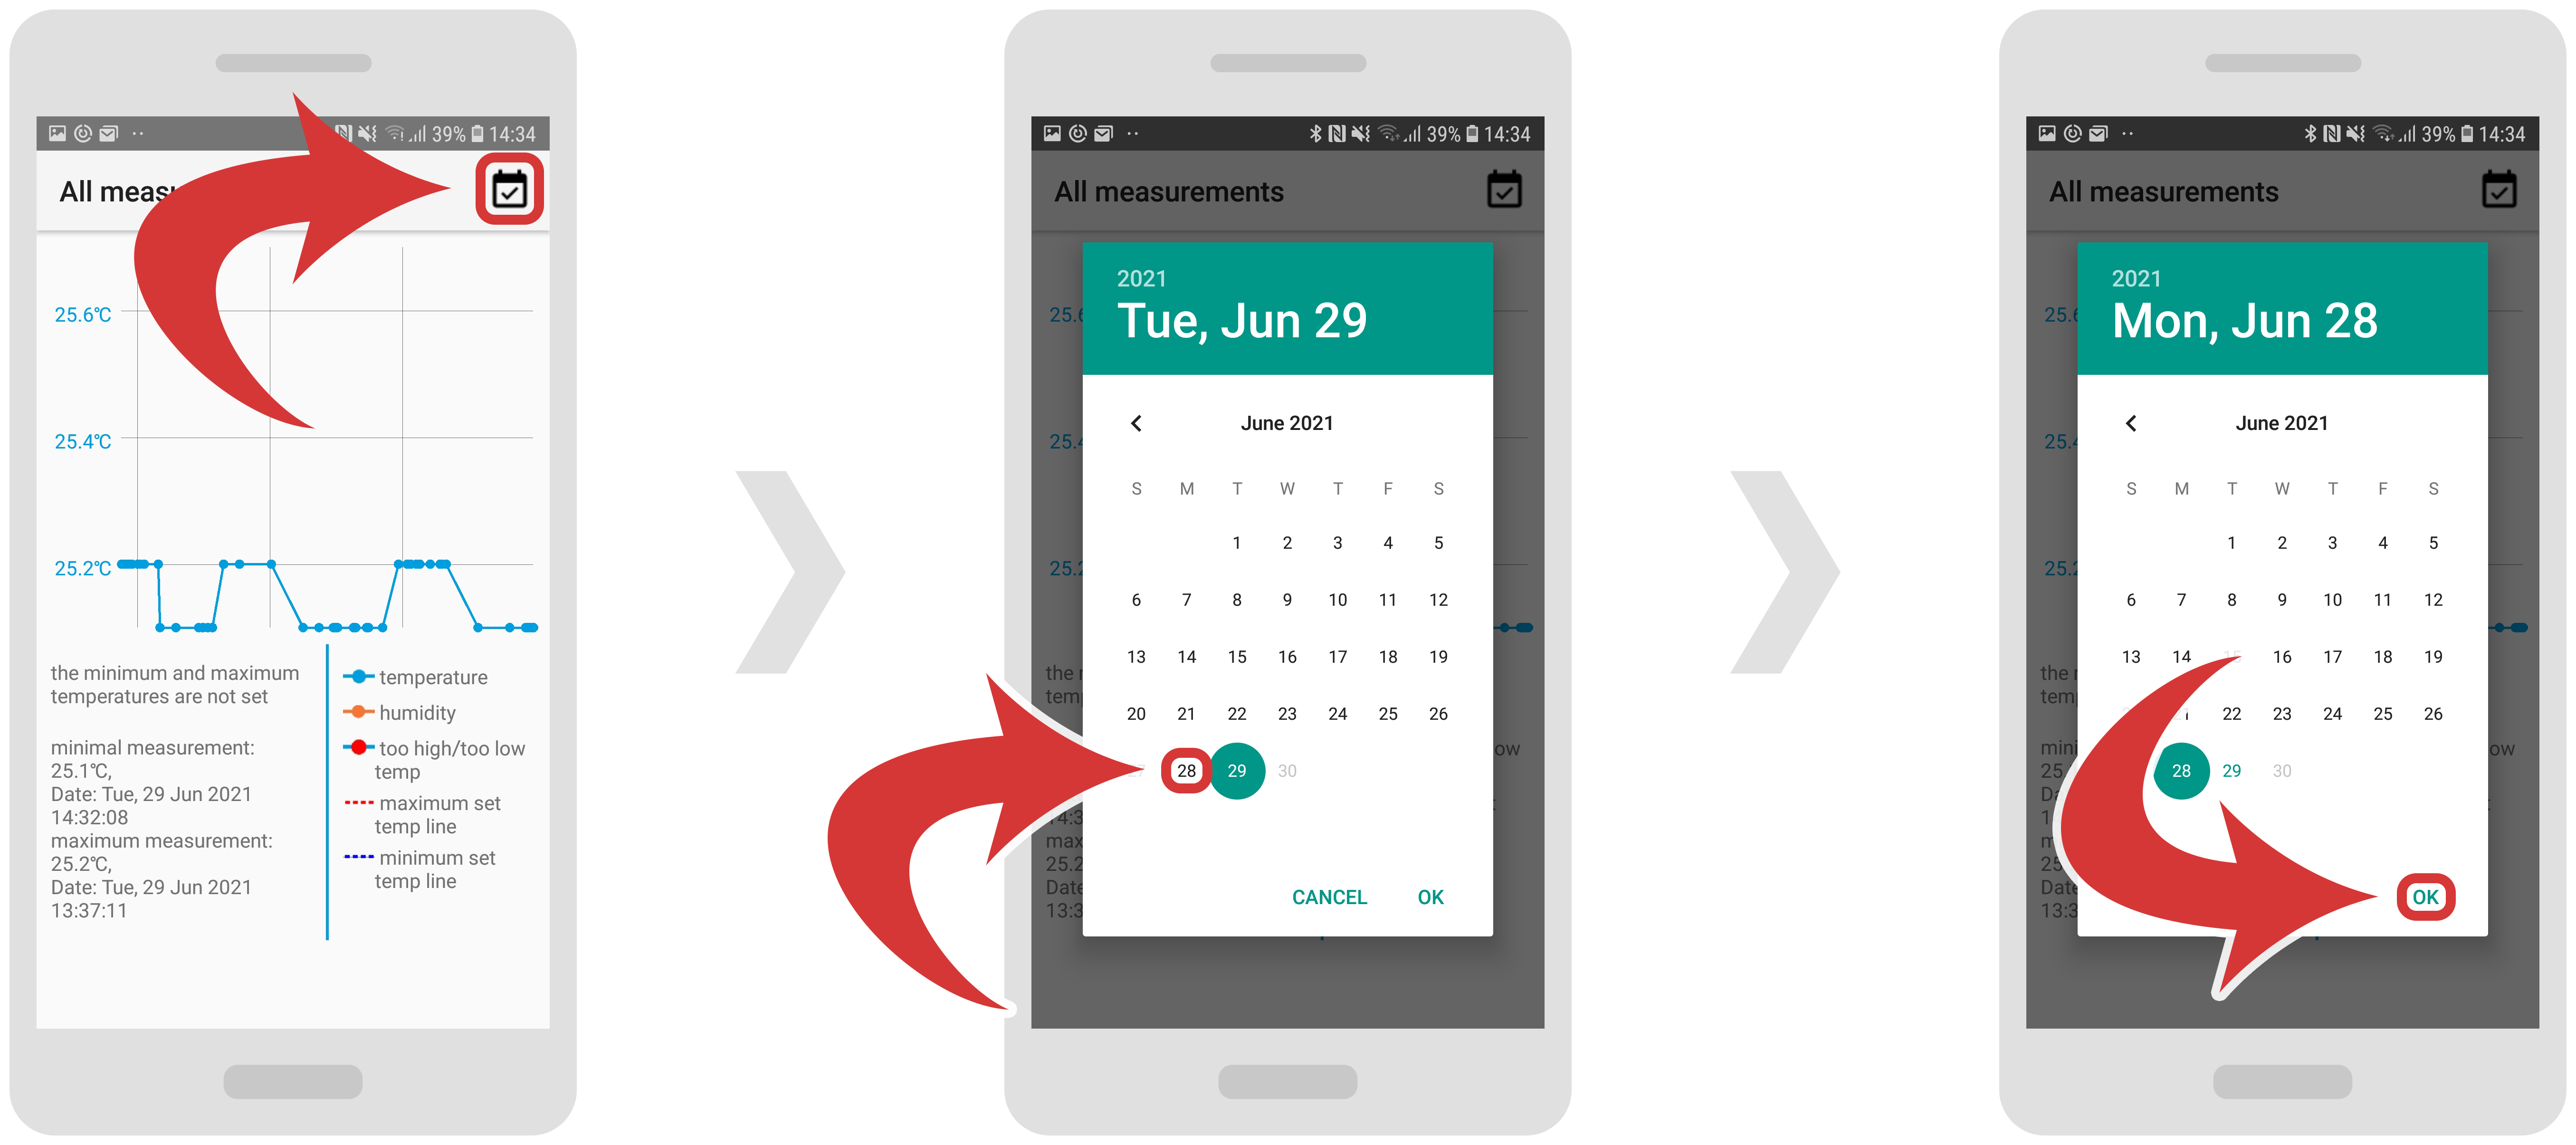
In order to show a graph for a specific date, tap on the “calendar” icon located at the top right. A new window should pop up.
Select your desired date and tap on the “OK” button.
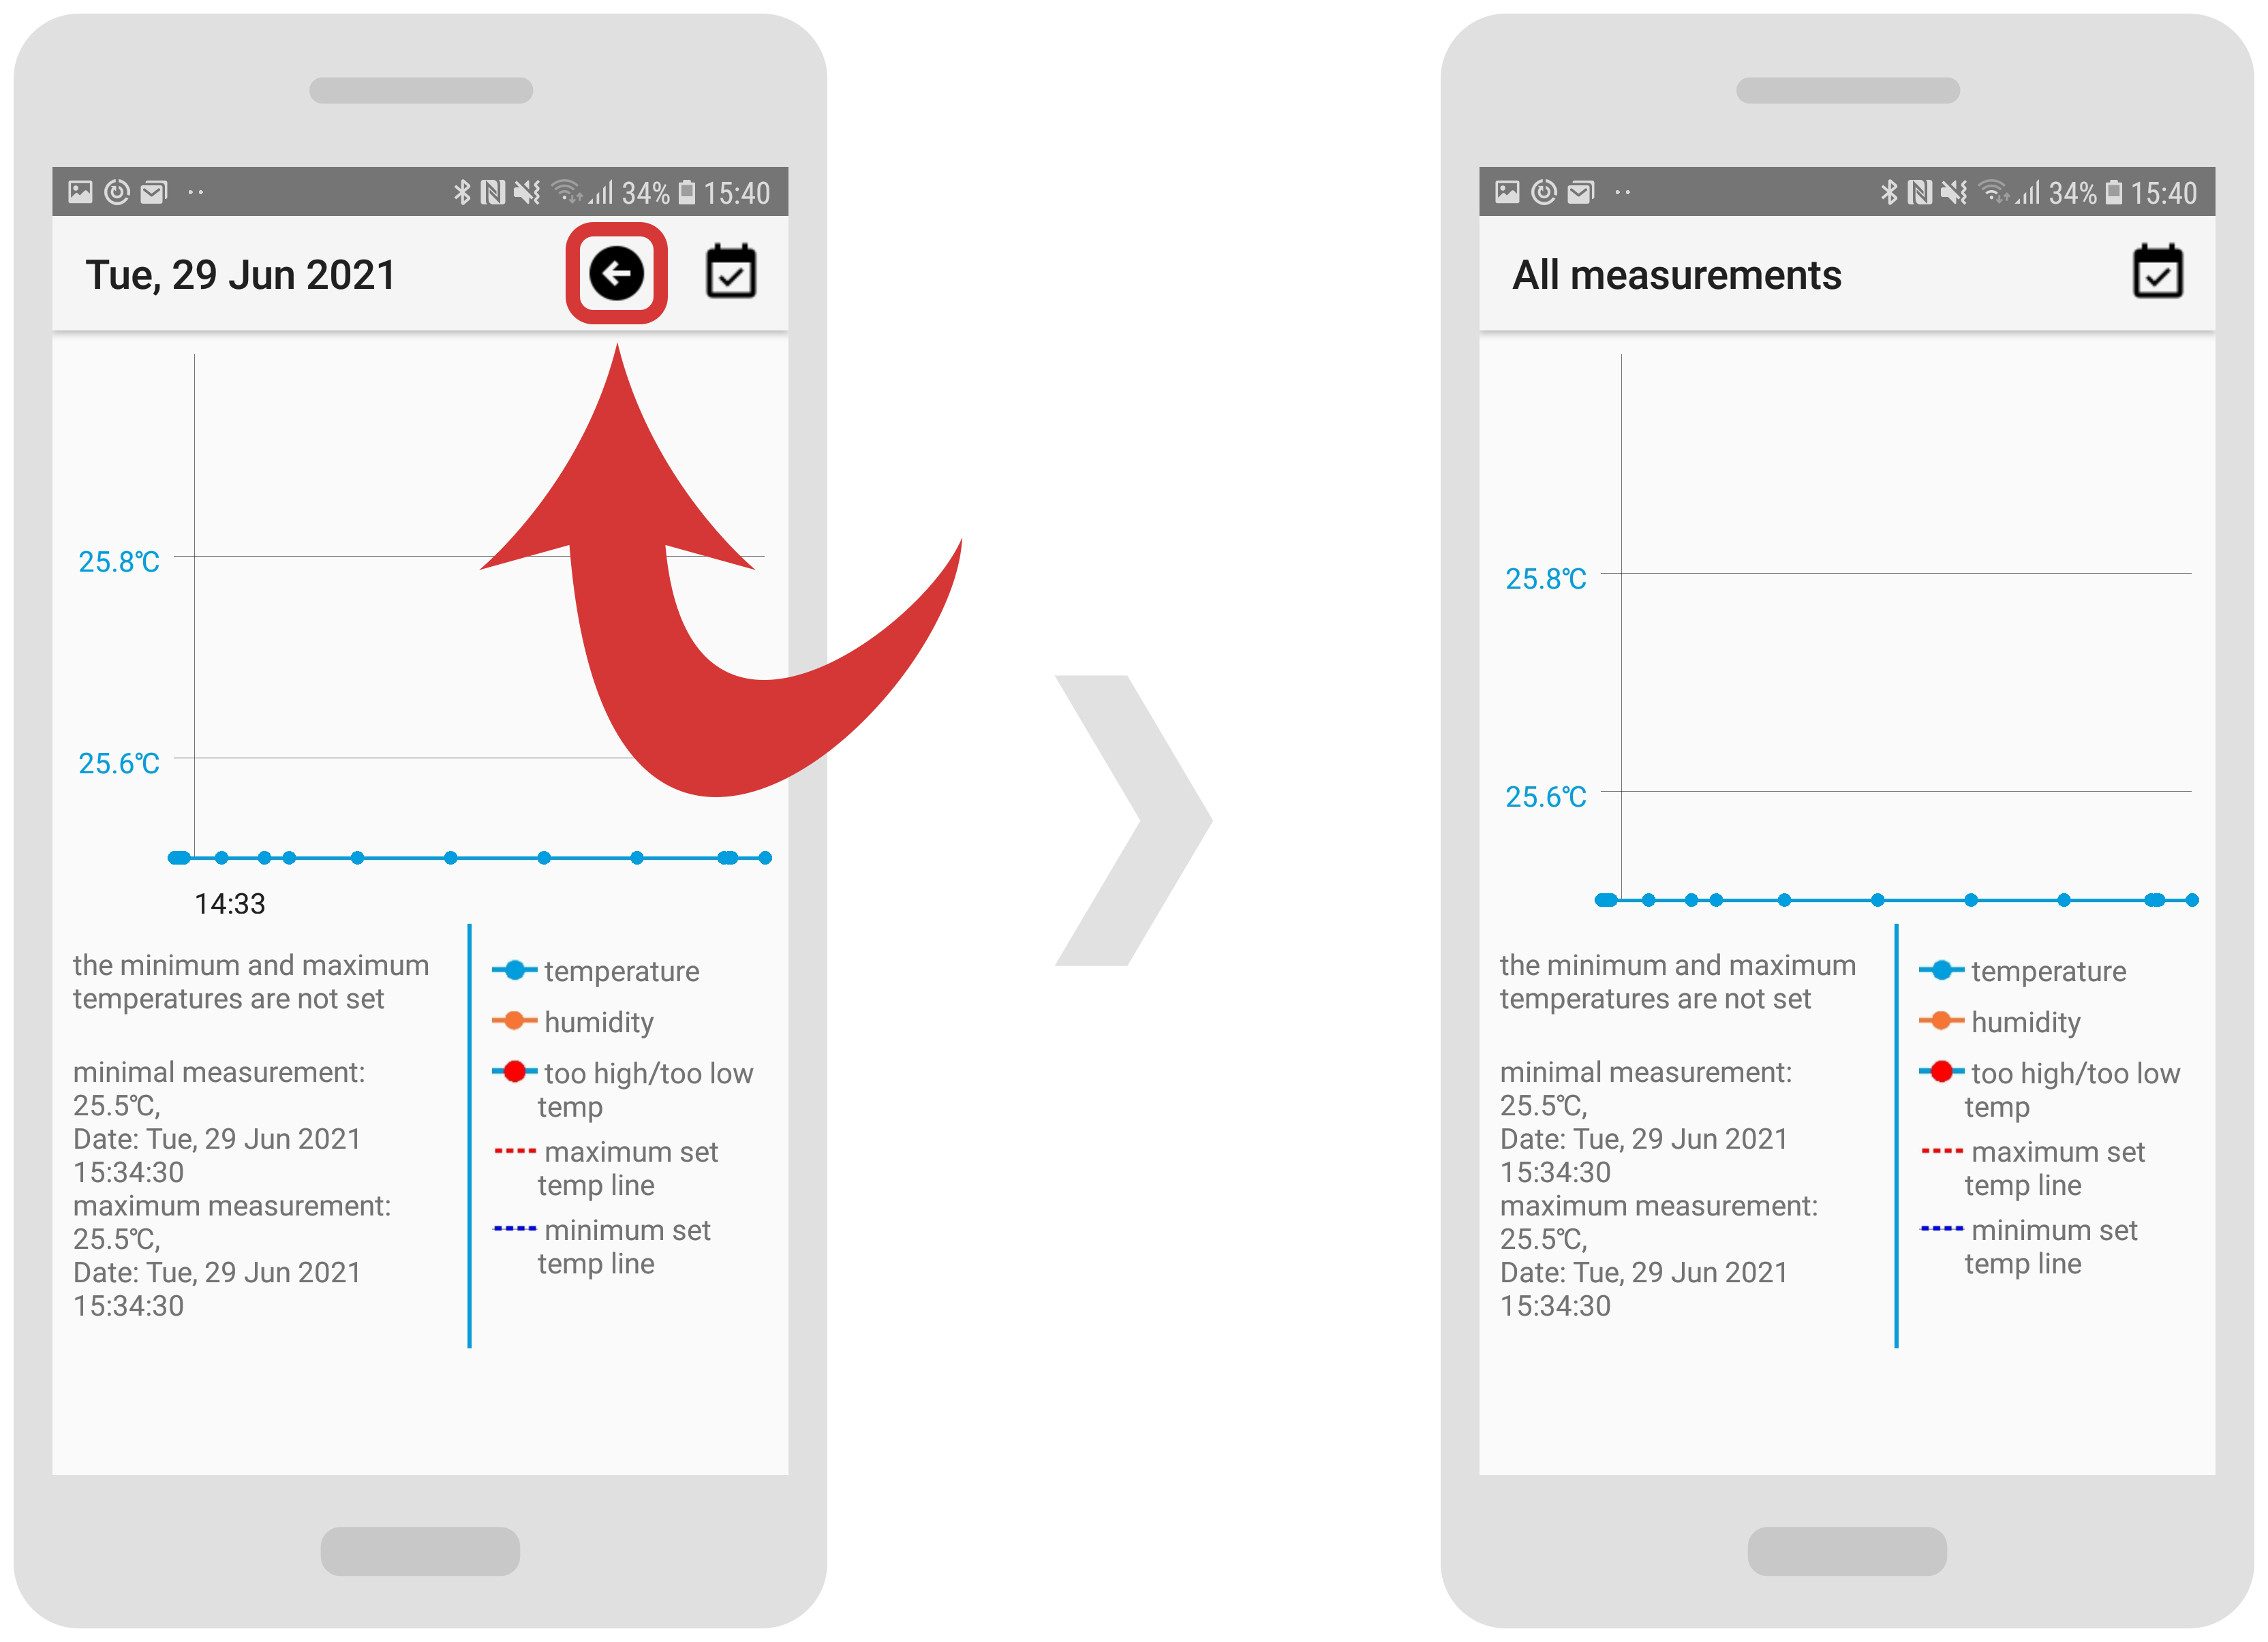
In order to go back from specific date filtering to a whole period, tap on the “left arrow” icon located at the top right.