-
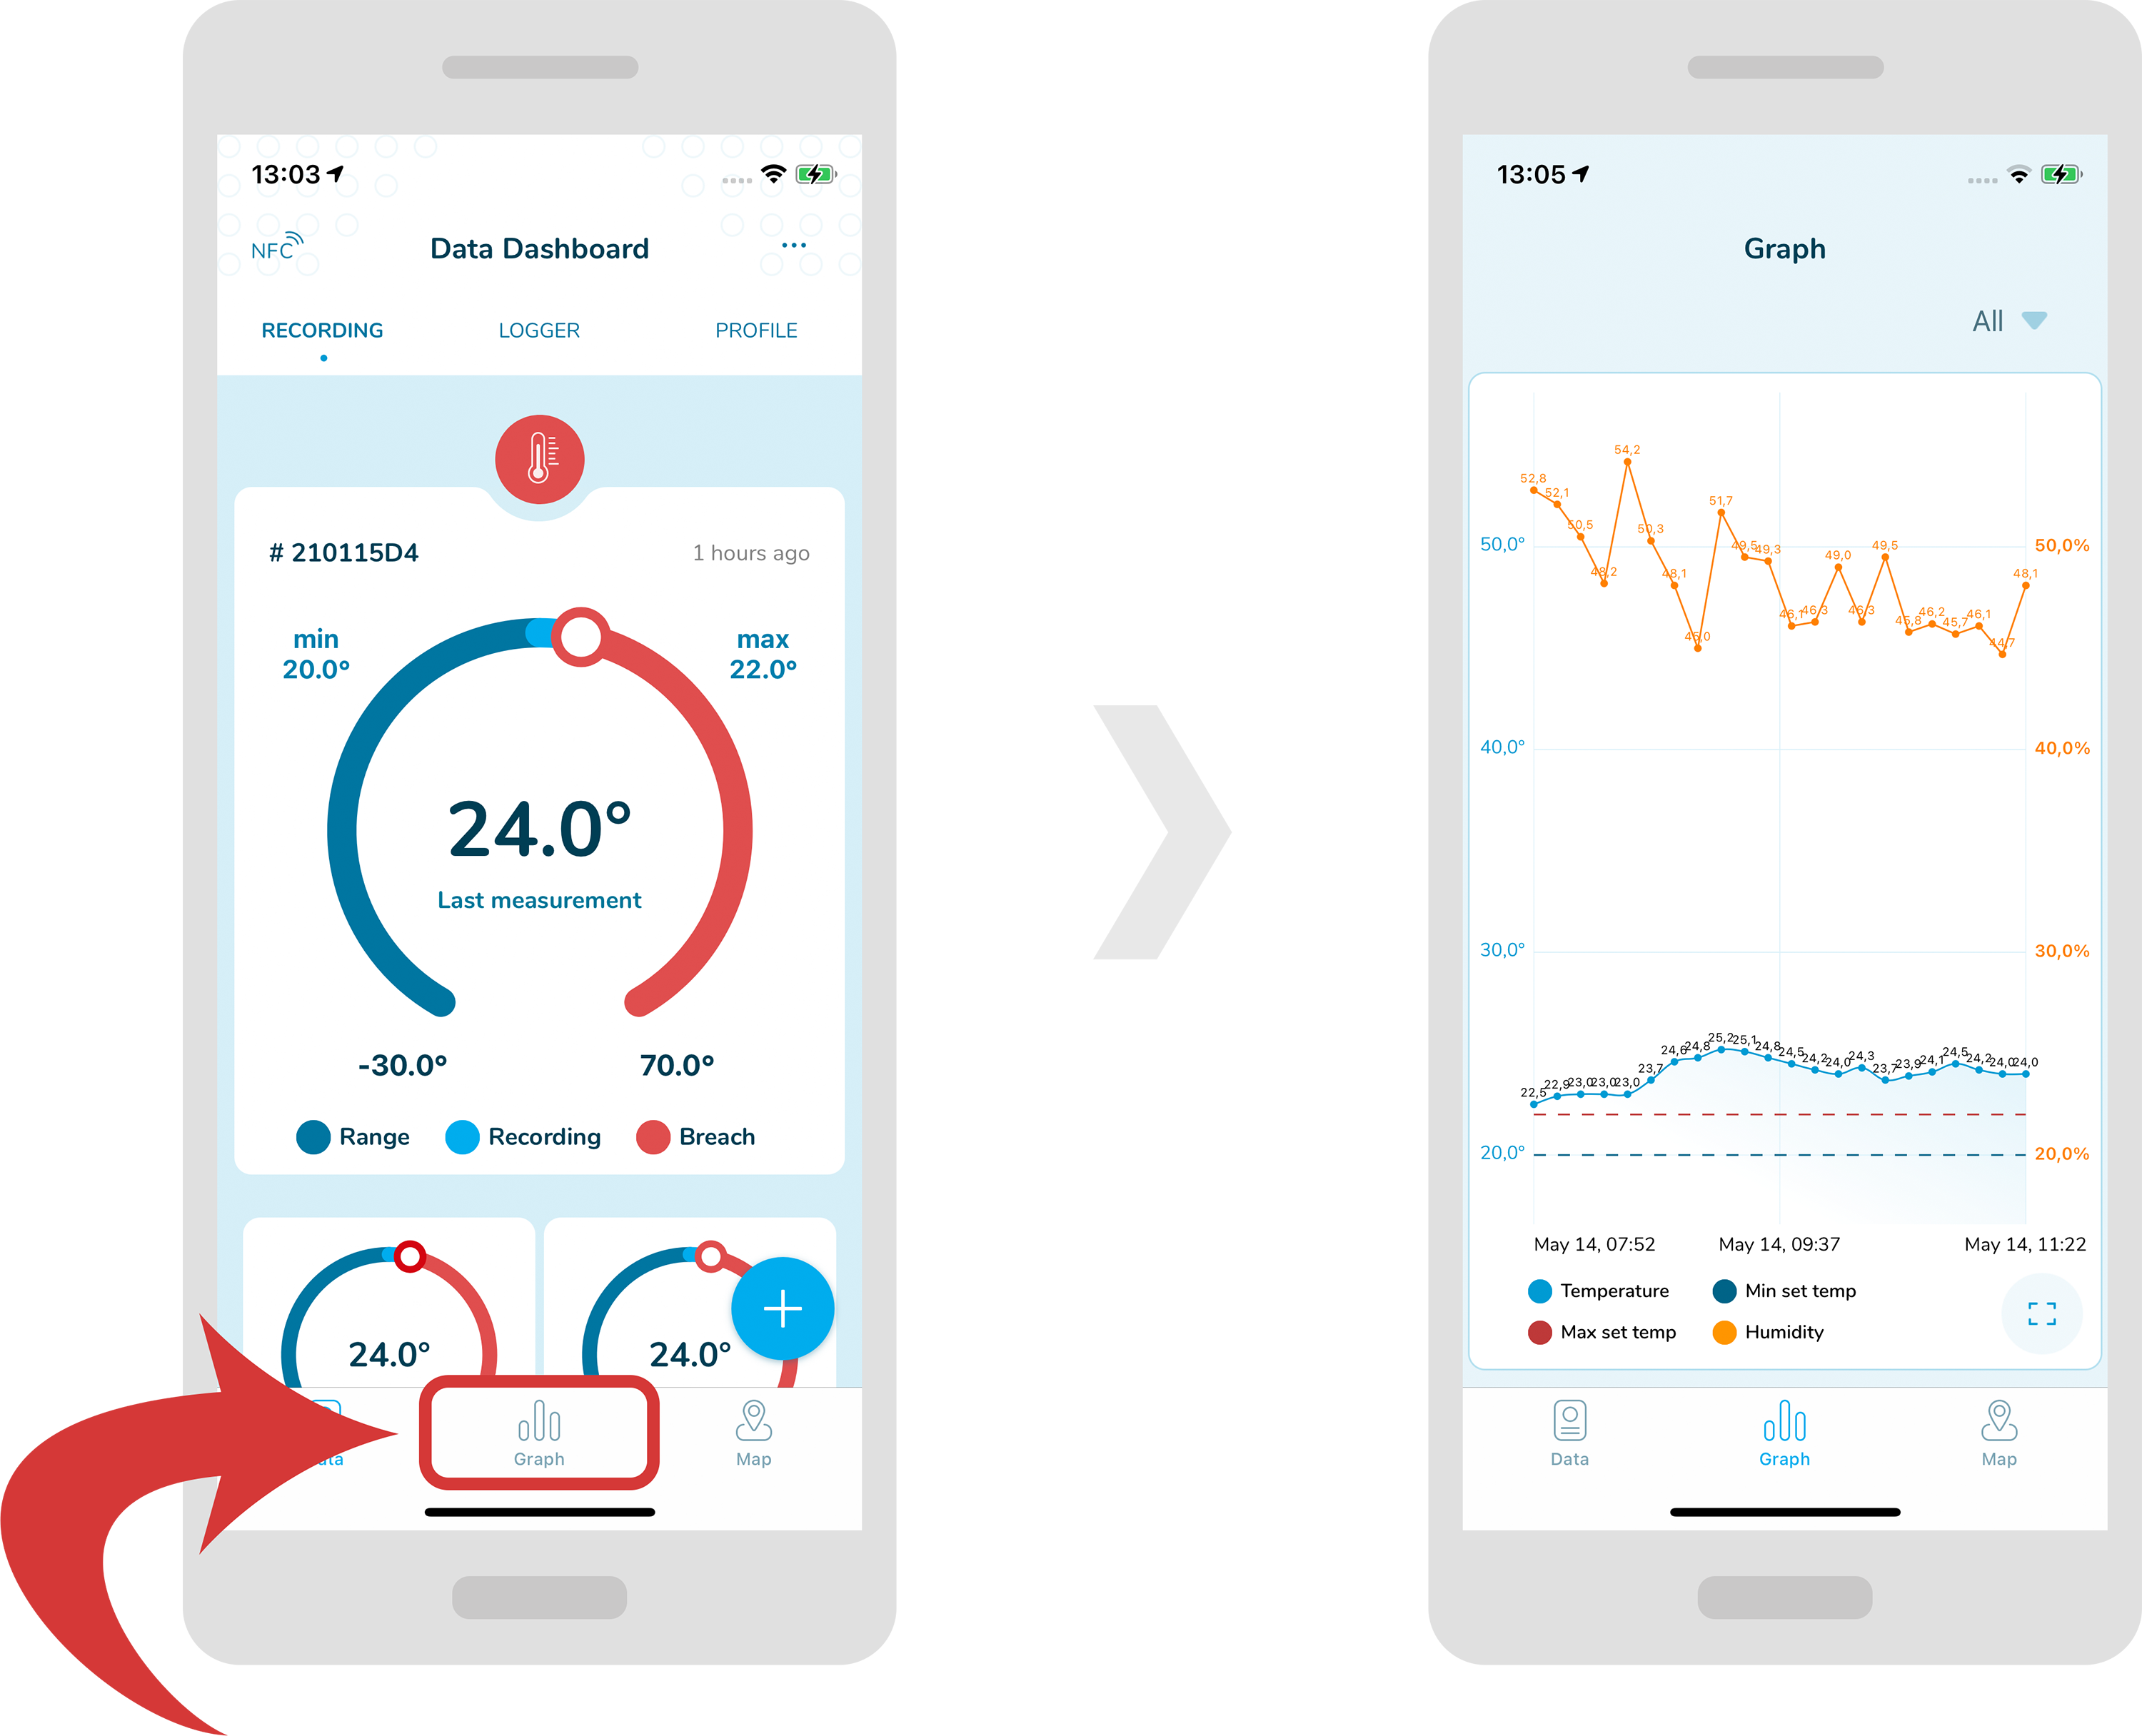
In order to see a graph, select a “Graph” tab from the bottom menu.
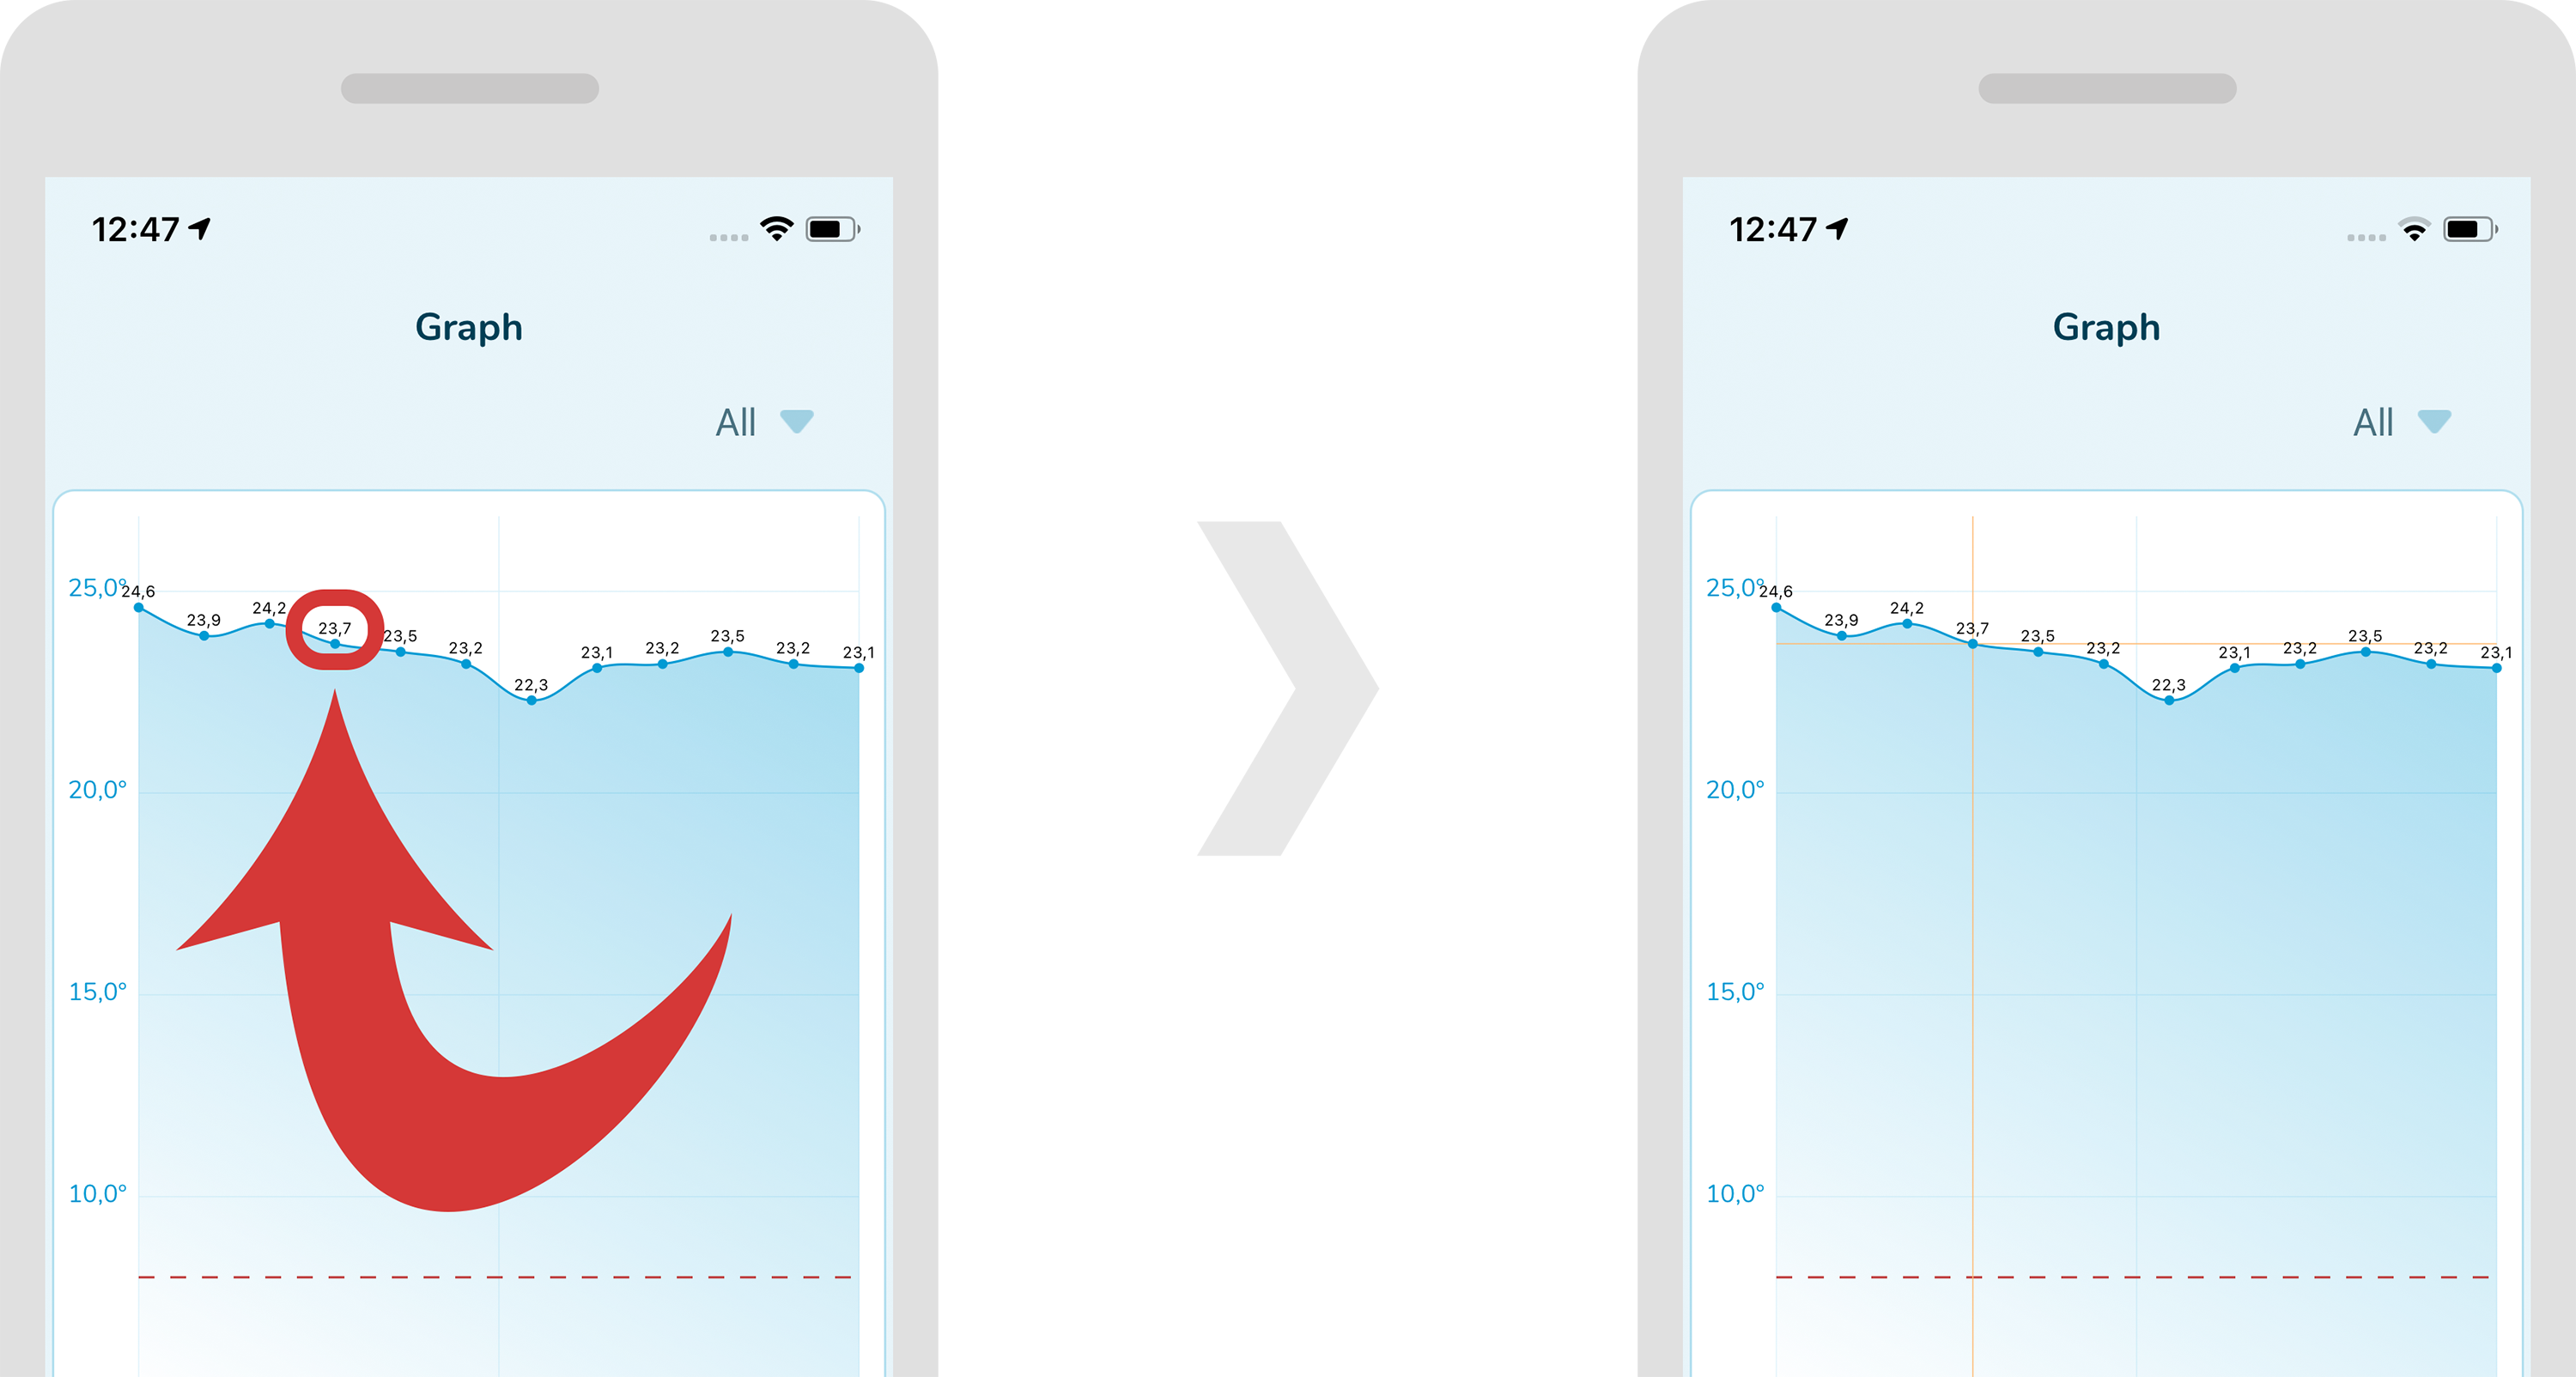
In order to select a point on a graph, just tap near the specified point. Now, orange lines should appear crossing this point.
-
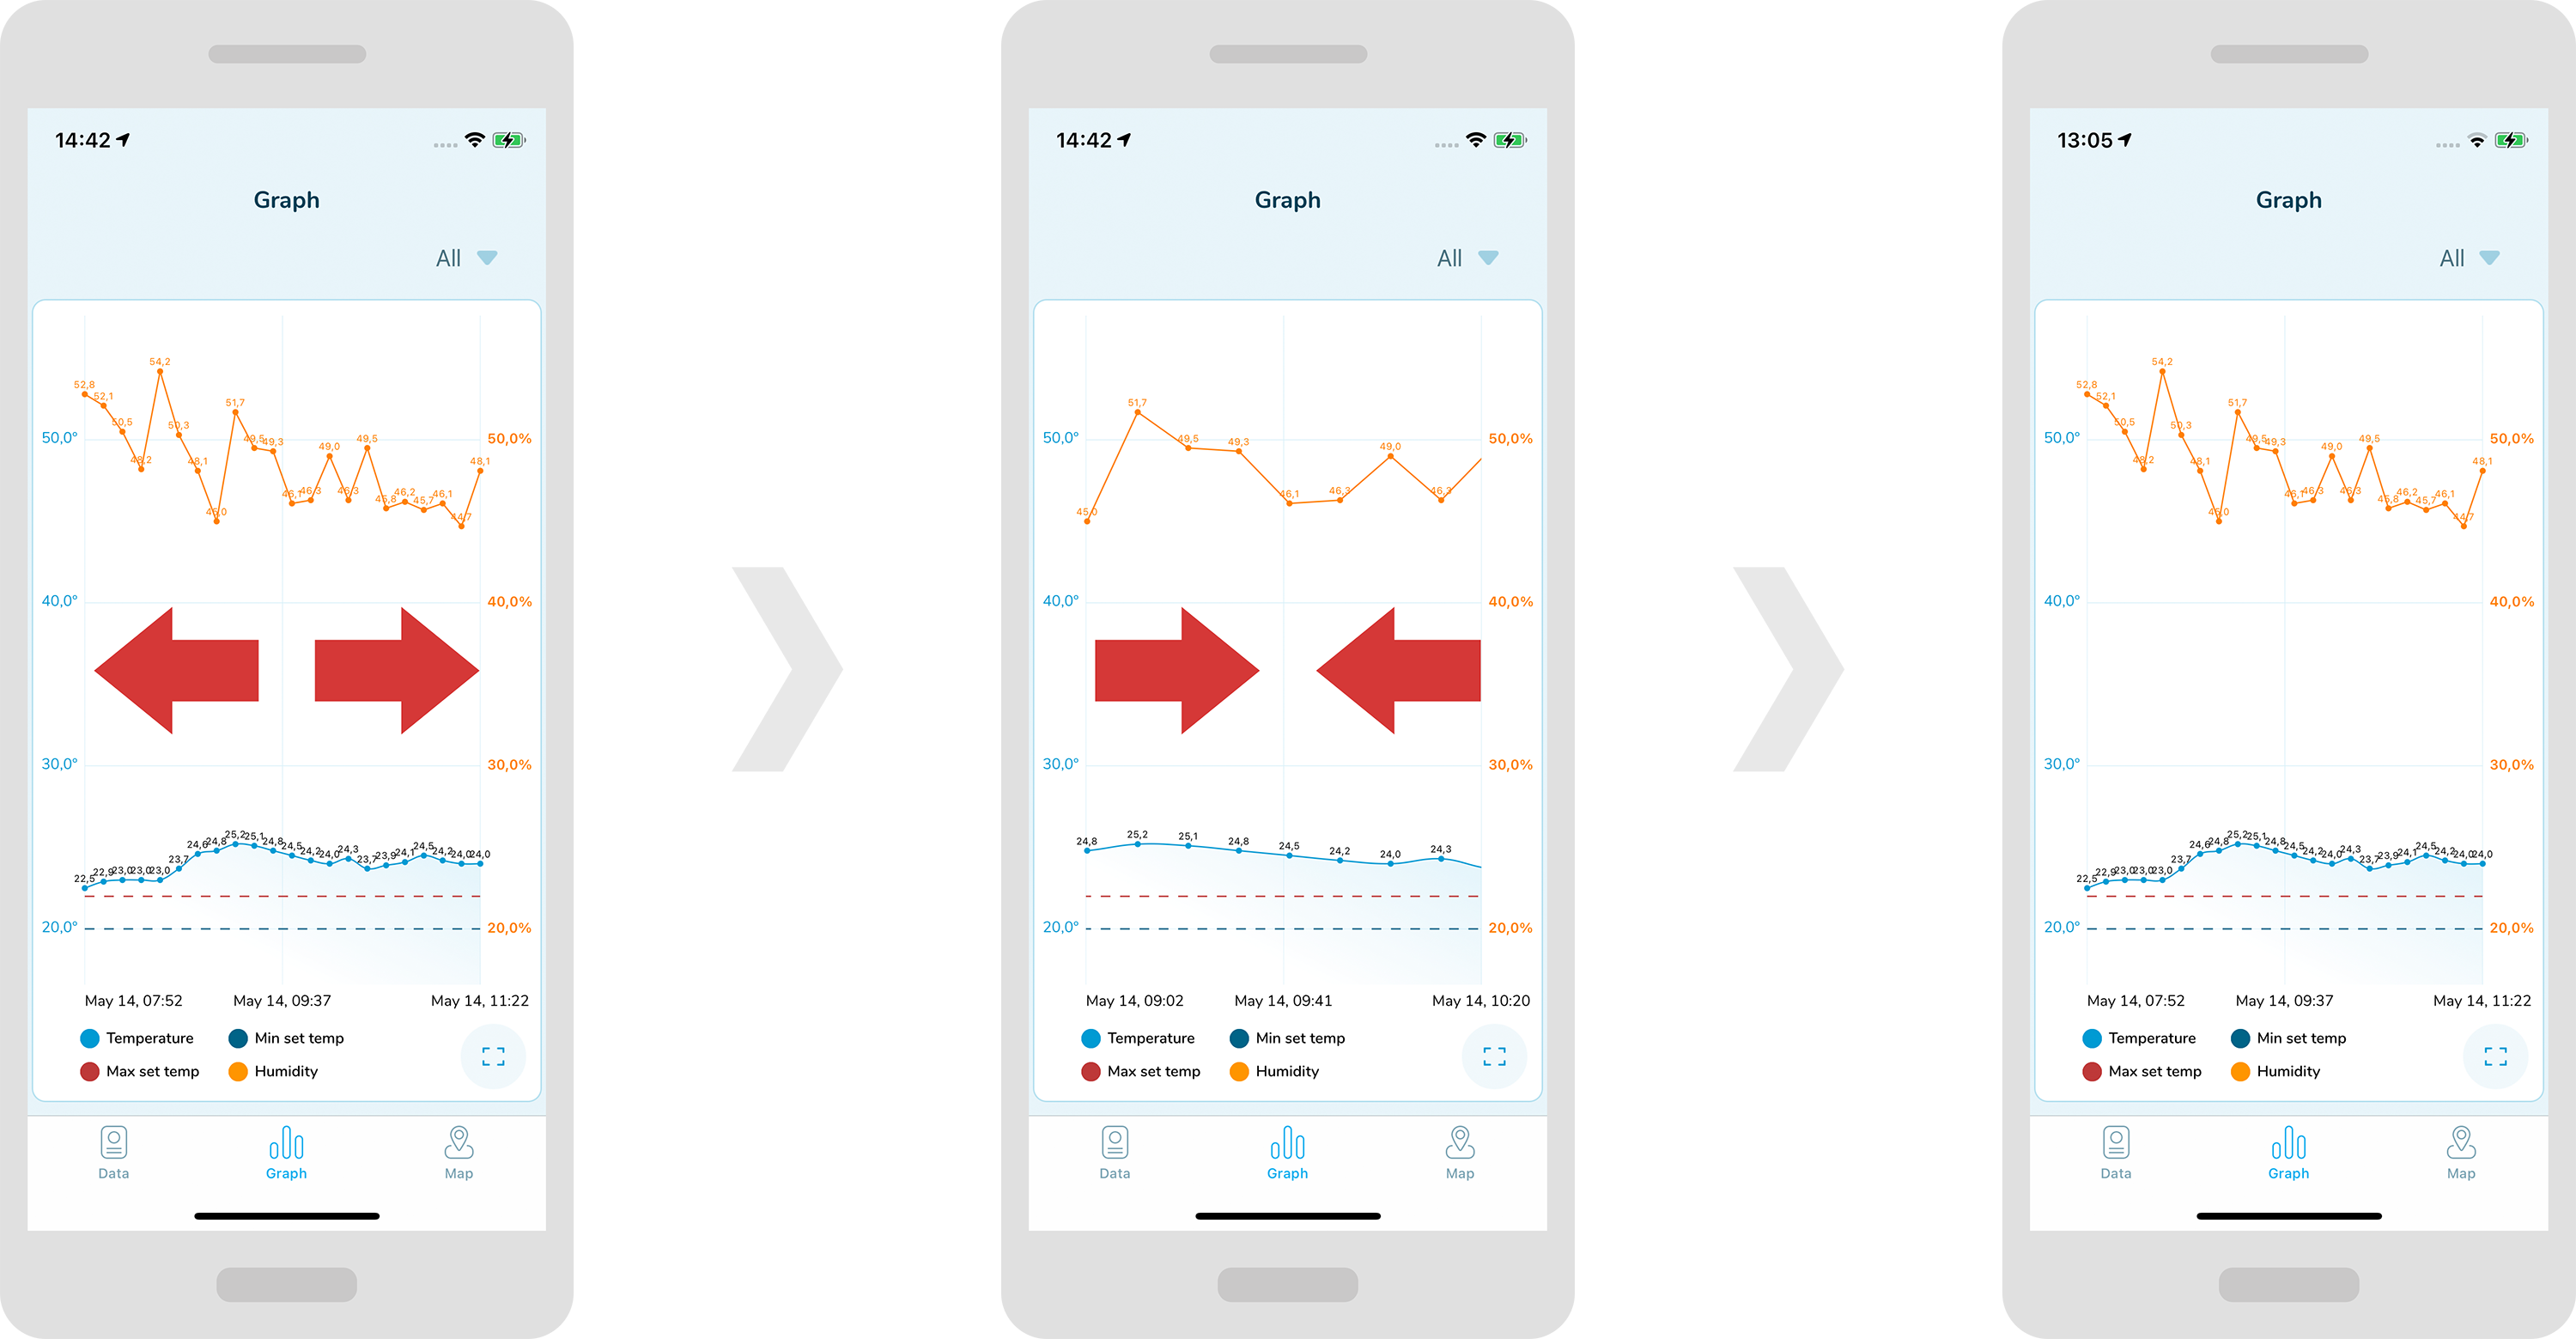
In order to widen or shrink the graph horizontally, drag it or expand it with your fingers horizontally.
-
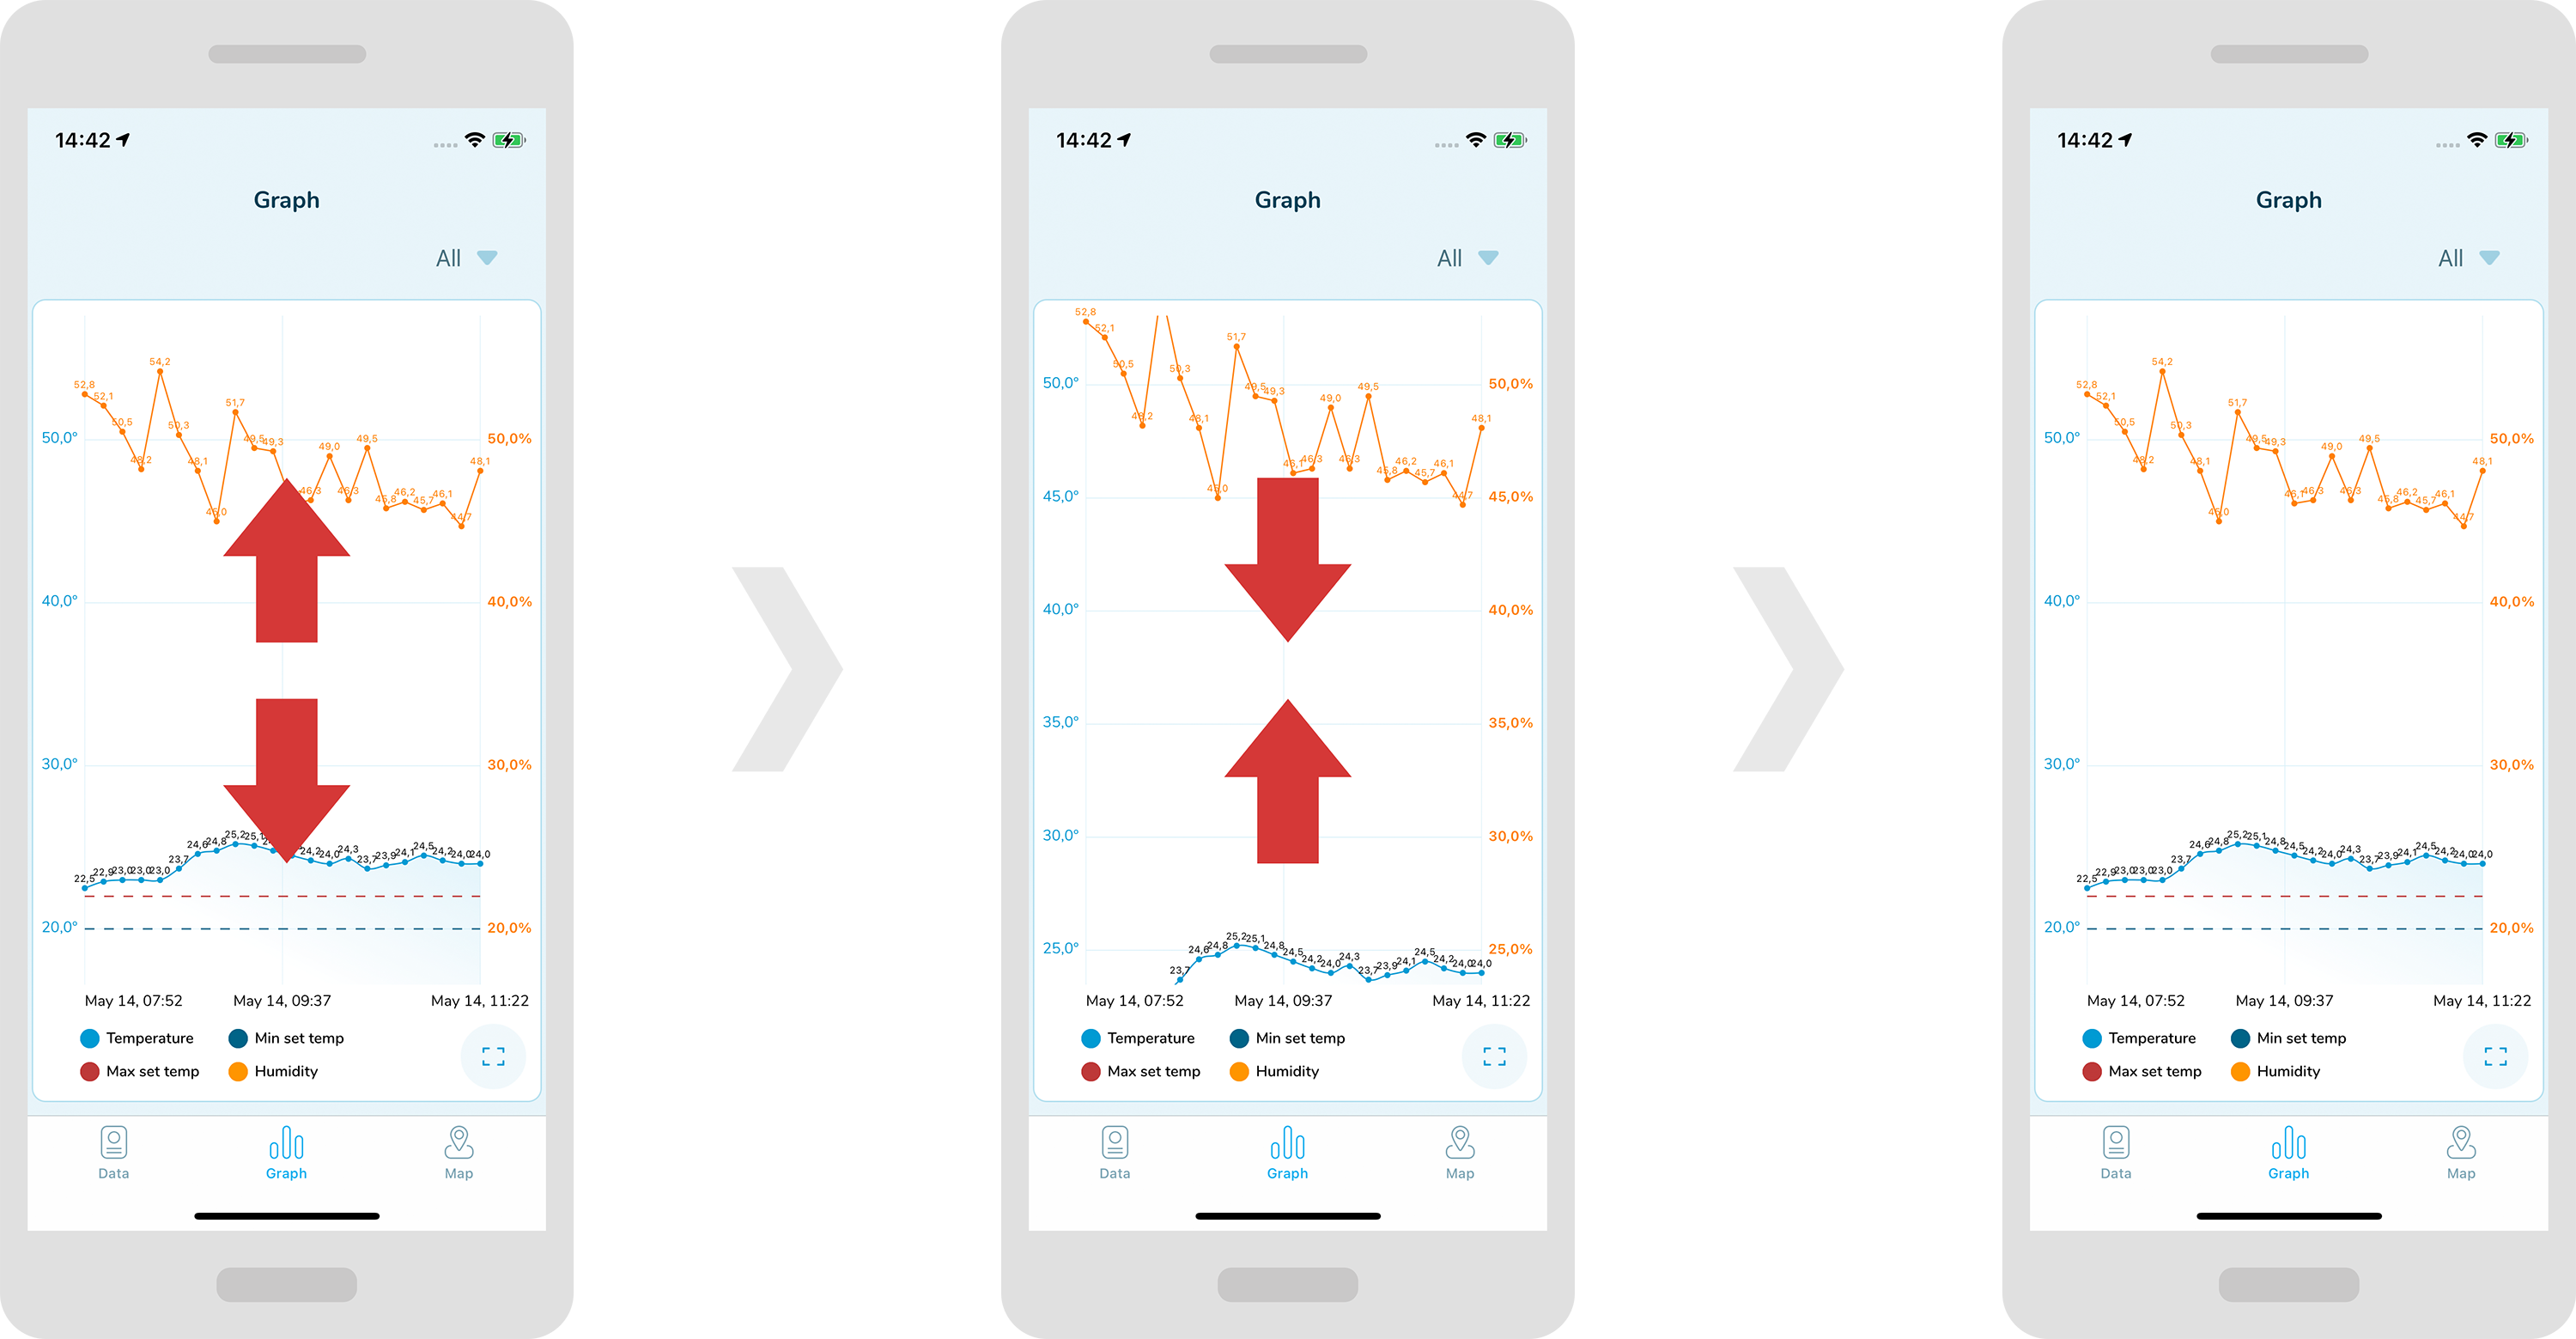
in order to widen or shrink the graph vertically, drag it or expand it with your fingers vertically.
-
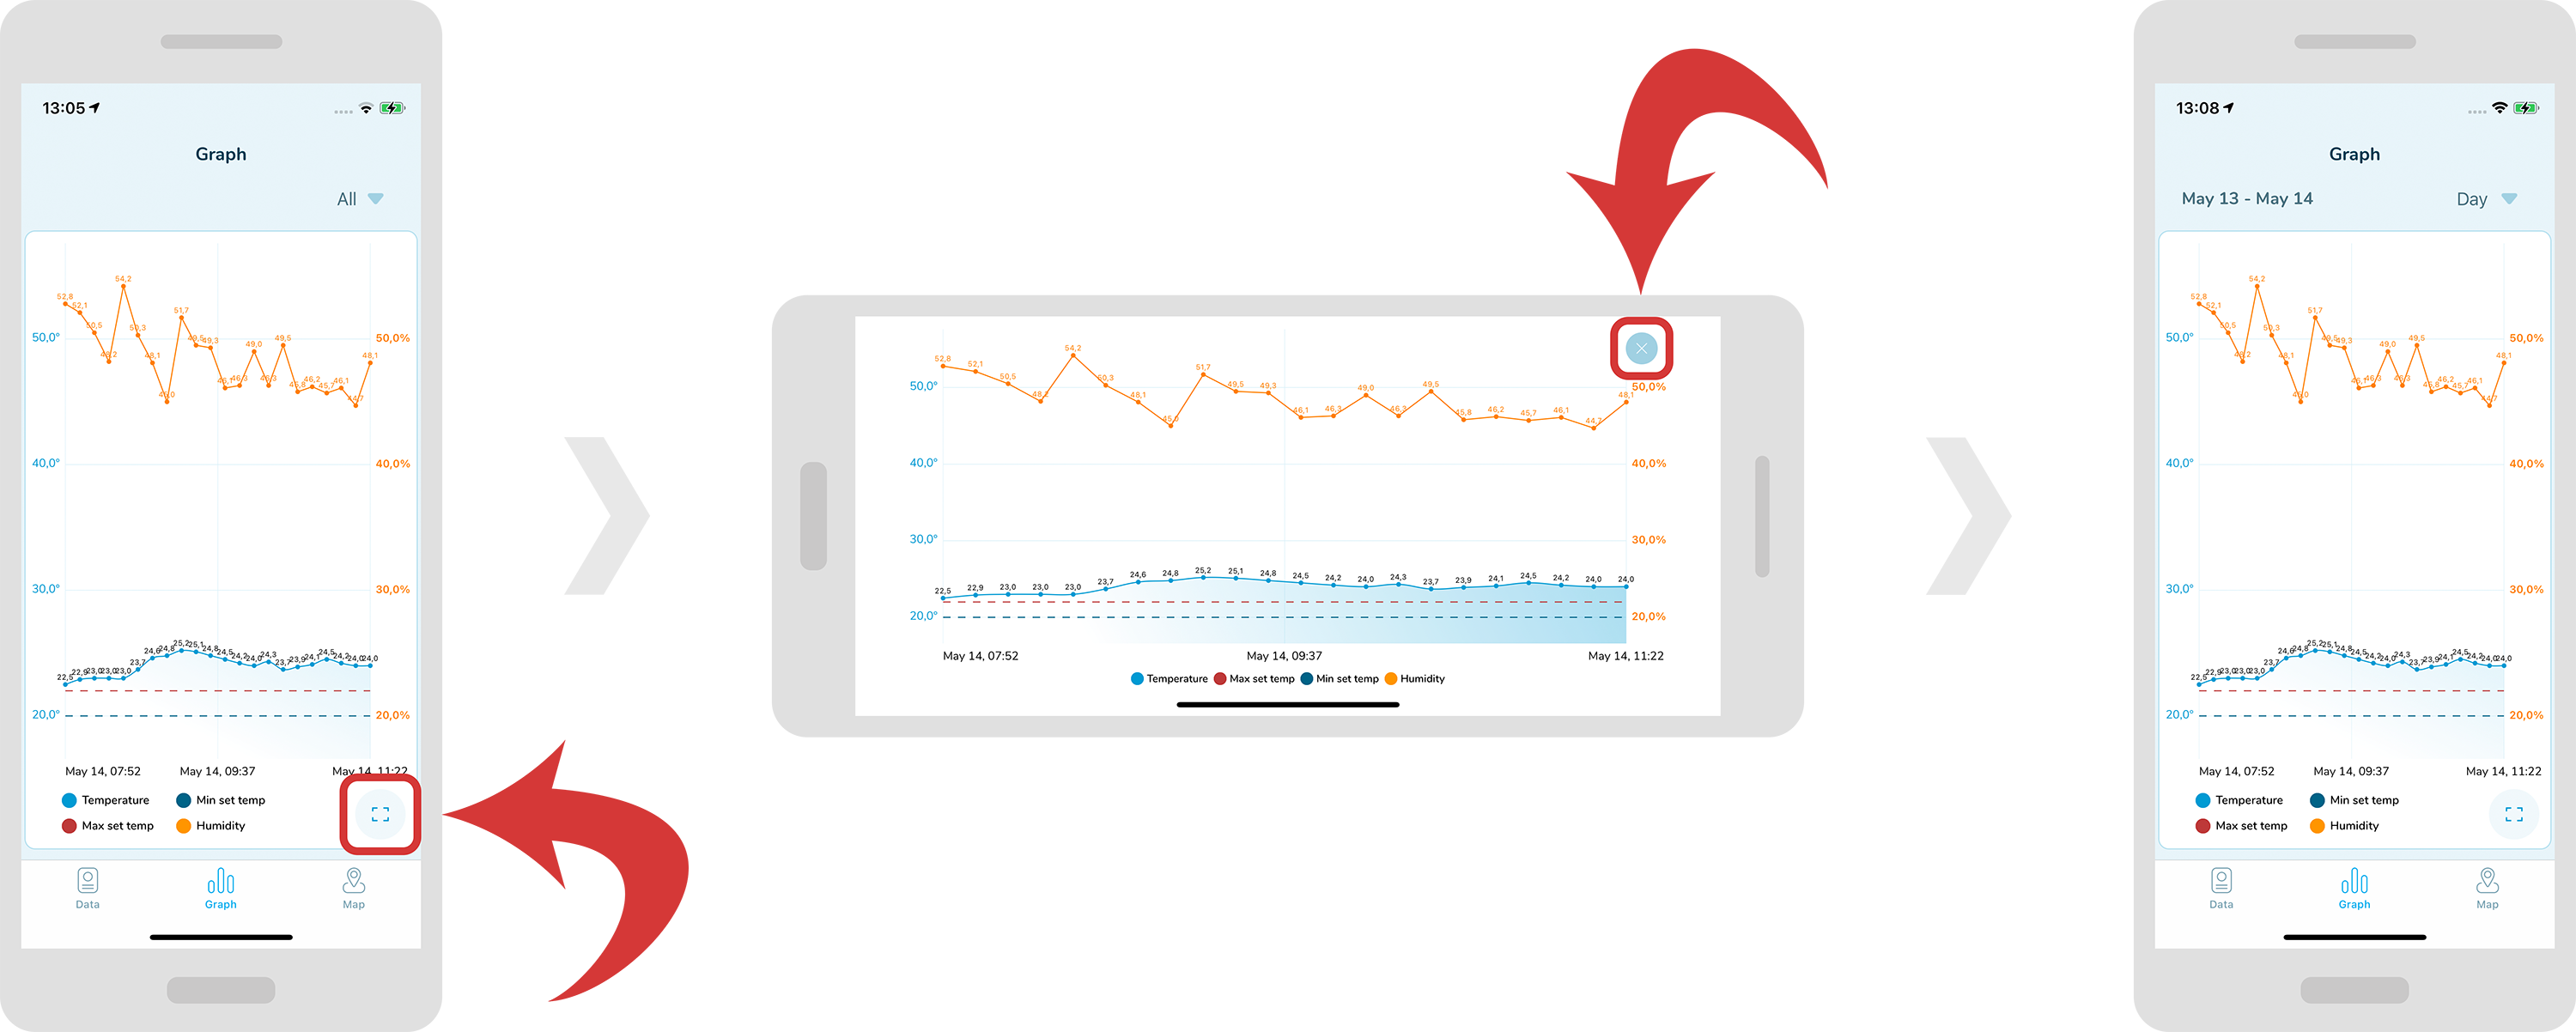
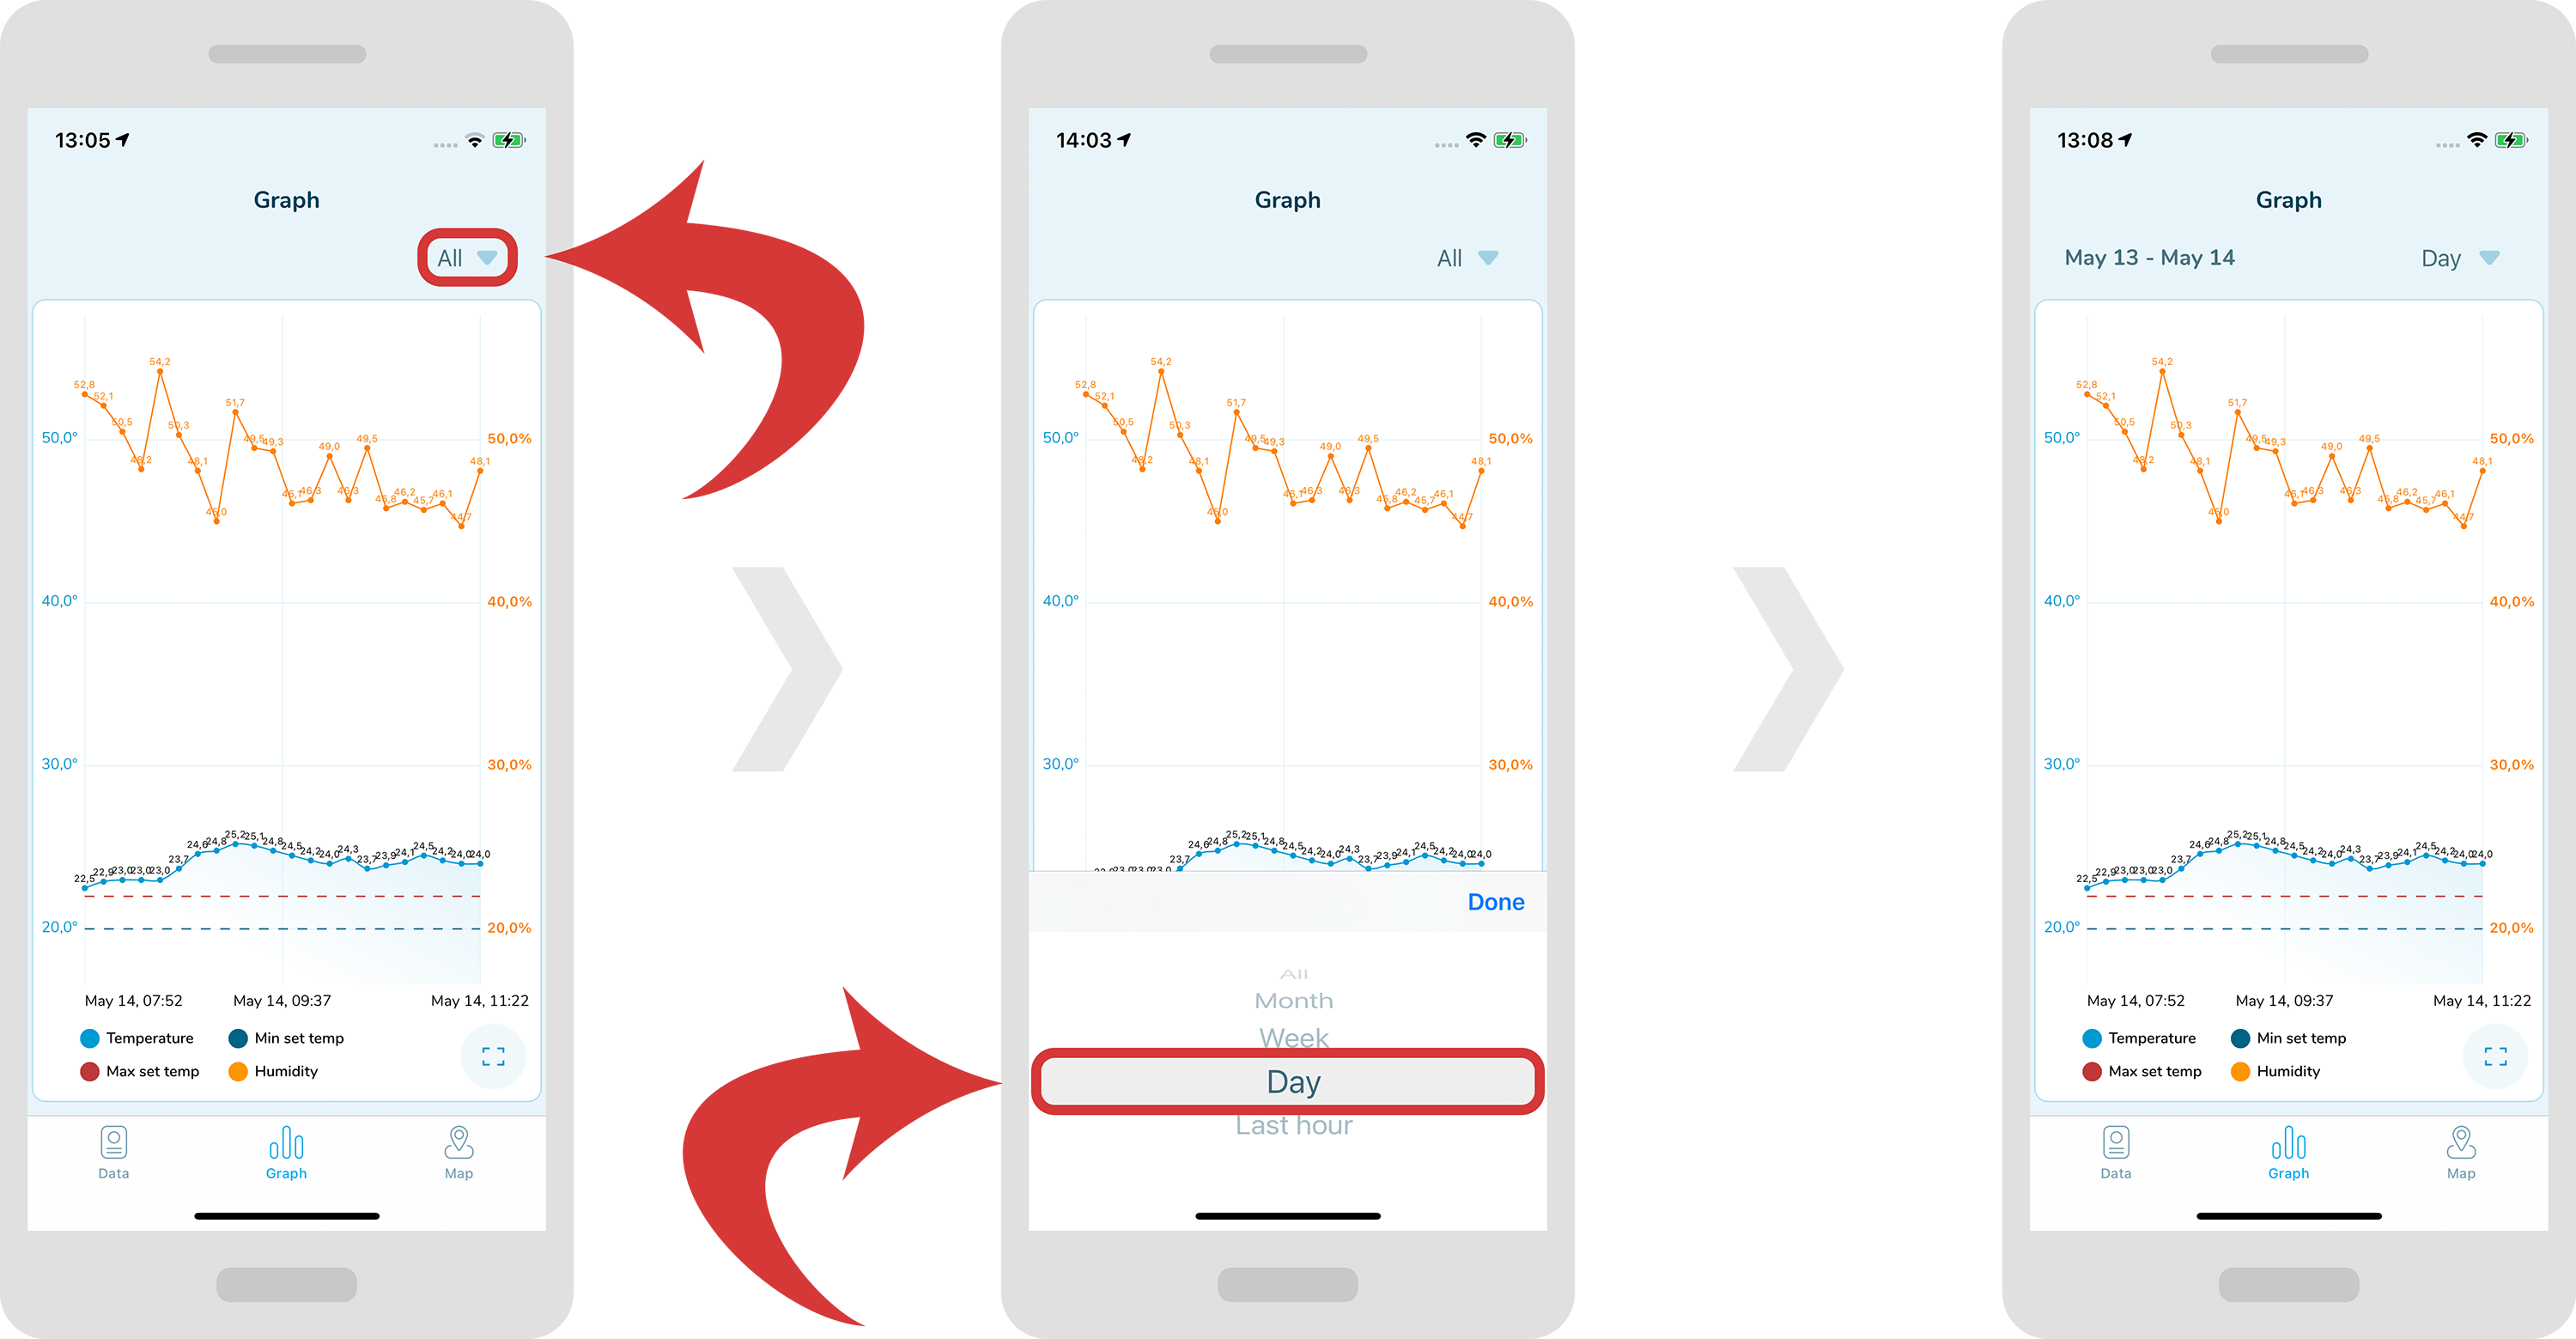
In order to show the graph for a specific range, tap on the dropdown menu at the top right and choose a specific filtration.
-
in order to see a graph on a full screen, tap on the “full screen” icon located at the bottom right. In order to quit the full screen mode, just tap on the “x” icon located at the top right.